Subsaharan African vs Immigrants from Liberia Median Family Income
COMPARE
Subsaharan African
Immigrants from Liberia
Median Family Income
Median Family Income Comparison
Sub-Saharan Africans
Immigrants from Liberia
$93,748
MEDIAN FAMILY INCOME
1.0/ 100
METRIC RATING
244th/ 347
METRIC RANK
$90,450
MEDIAN FAMILY INCOME
0.2/ 100
METRIC RATING
272nd/ 347
METRIC RANK
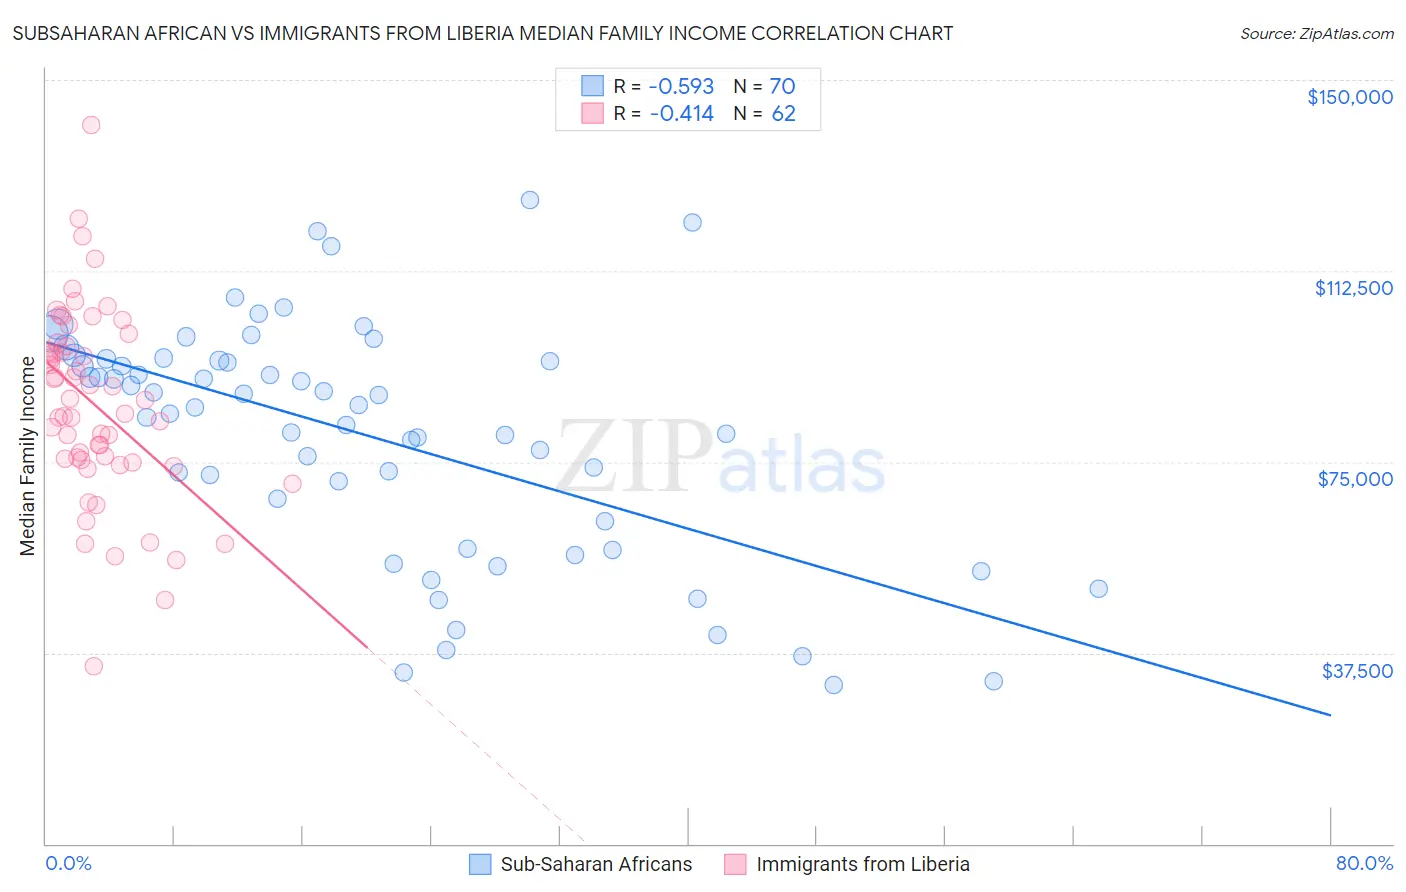
Subsaharan African vs Immigrants from Liberia Median Family Income Correlation Chart
The statistical analysis conducted on geographies consisting of 507,233,451 people shows a substantial negative correlation between the proportion of Sub-Saharan Africans and median family income in the United States with a correlation coefficient (R) of -0.593 and weighted average of $93,748. Similarly, the statistical analysis conducted on geographies consisting of 135,228,267 people shows a moderate negative correlation between the proportion of Immigrants from Liberia and median family income in the United States with a correlation coefficient (R) of -0.414 and weighted average of $90,450, a difference of 3.6%.
Median Family Income Correlation Summary
| Measurement | Subsaharan African | Immigrants from Liberia |
| Minimum | $31,084 | $34,978 |
| Maximum | $126,507 | $141,080 |
| Range | $95,423 | $106,102 |
| Mean | $80,060 | $86,151 |
| Median | $85,890 | $85,817 |
| Interquartile 25% (IQ1) | $63,281 | $75,284 |
| Interquartile 75% (IQ3) | $94,886 | $97,769 |
| Interquartile Range (IQR) | $31,605 | $22,485 |
| Standard Deviation (Sample) | $22,942 | $18,837 |
| Standard Deviation (Population) | $22,778 | $18,685 |
Similar Demographics by Median Family Income
Demographics Similar to Sub-Saharan Africans by Median Family Income
In terms of median family income, the demographic groups most similar to Sub-Saharan Africans are German Russian ($93,858, a difference of 0.12%), Immigrants from Middle Africa ($93,593, a difference of 0.17%), Barbadian ($93,919, a difference of 0.18%), Immigrants from Trinidad and Tobago ($93,988, a difference of 0.26%), and Somali ($94,085, a difference of 0.36%).
| Demographics | Rating | Rank | Median Family Income |
| Alaskan Athabascans | 1.5 /100 | #237 | Tragic $94,429 |
| Nepalese | 1.3 /100 | #238 | Tragic $94,153 |
| Salvadorans | 1.2 /100 | #239 | Tragic $94,109 |
| Somalis | 1.2 /100 | #240 | Tragic $94,085 |
| Immigrants | Trinidad and Tobago | 1.2 /100 | #241 | Tragic $93,988 |
| Barbadians | 1.1 /100 | #242 | Tragic $93,919 |
| German Russians | 1.1 /100 | #243 | Tragic $93,858 |
| Sub-Saharan Africans | 1.0 /100 | #244 | Tragic $93,748 |
| Immigrants | Middle Africa | 1.0 /100 | #245 | Tragic $93,593 |
| Guyanese | 0.9 /100 | #246 | Tragic $93,373 |
| Immigrants | Senegal | 0.7 /100 | #247 | Tragic $92,912 |
| French American Indians | 0.7 /100 | #248 | Tragic $92,872 |
| Immigrants | Ecuador | 0.7 /100 | #249 | Tragic $92,837 |
| West Indians | 0.6 /100 | #250 | Tragic $92,765 |
| Immigrants | Somalia | 0.6 /100 | #251 | Tragic $92,609 |
Demographics Similar to Immigrants from Liberia by Median Family Income
In terms of median family income, the demographic groups most similar to Immigrants from Liberia are Iroquois ($90,543, a difference of 0.10%), Immigrants from Micronesia ($90,345, a difference of 0.12%), Jamaican ($90,581, a difference of 0.14%), Spanish American ($90,322, a difference of 0.14%), and Immigrants from St. Vincent and the Grenadines ($90,094, a difference of 0.40%).
| Demographics | Rating | Rank | Median Family Income |
| Hmong | 0.3 /100 | #265 | Tragic $91,296 |
| Central Americans | 0.3 /100 | #266 | Tragic $91,087 |
| Mexican American Indians | 0.2 /100 | #267 | Tragic $90,918 |
| Cree | 0.2 /100 | #268 | Tragic $90,882 |
| Belizeans | 0.2 /100 | #269 | Tragic $90,880 |
| Jamaicans | 0.2 /100 | #270 | Tragic $90,581 |
| Iroquois | 0.2 /100 | #271 | Tragic $90,543 |
| Immigrants | Liberia | 0.2 /100 | #272 | Tragic $90,450 |
| Immigrants | Micronesia | 0.2 /100 | #273 | Tragic $90,345 |
| Spanish Americans | 0.2 /100 | #274 | Tragic $90,322 |
| Immigrants | St. Vincent and the Grenadines | 0.2 /100 | #275 | Tragic $90,094 |
| Immigrants | Zaire | 0.1 /100 | #276 | Tragic $89,285 |
| Immigrants | Jamaica | 0.1 /100 | #277 | Tragic $89,268 |
| Immigrants | Grenada | 0.1 /100 | #278 | Tragic $89,249 |
| Immigrants | Belize | 0.1 /100 | #279 | Tragic $89,197 |