Iraqi vs Immigrants from Liberia Births to Unmarried Women
COMPARE
Iraqi
Immigrants from Liberia
Births to Unmarried Women
Births to Unmarried Women Comparison
Iraqis
Immigrants from Liberia
27.6%
BIRTHS TO UNMARRIED WOMEN
99.6/ 100
METRIC RATING
41st/ 347
METRIC RANK
37.6%
BIRTHS TO UNMARRIED WOMEN
0.0/ 100
METRIC RATING
288th/ 347
METRIC RANK
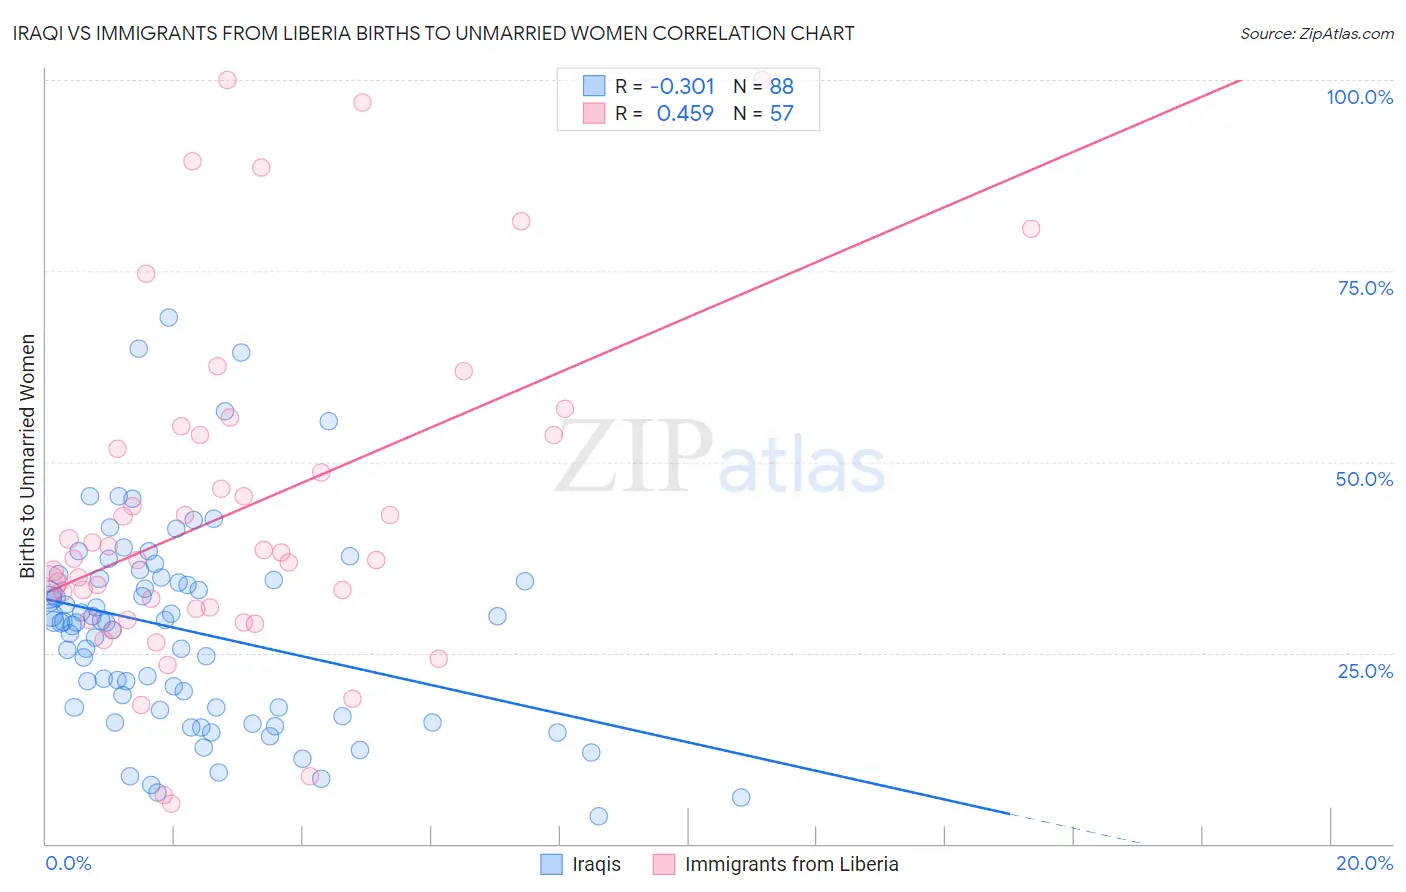
Iraqi vs Immigrants from Liberia Births to Unmarried Women Correlation Chart
The statistical analysis conducted on geographies consisting of 164,715,067 people shows a mild negative correlation between the proportion of Iraqis and percentage of births to unmarried women in the United States with a correlation coefficient (R) of -0.301 and weighted average of 27.6%. Similarly, the statistical analysis conducted on geographies consisting of 132,597,891 people shows a moderate positive correlation between the proportion of Immigrants from Liberia and percentage of births to unmarried women in the United States with a correlation coefficient (R) of 0.459 and weighted average of 37.6%, a difference of 36.5%.
Births to Unmarried Women Correlation Summary
| Measurement | Iraqi | Immigrants from Liberia |
| Minimum | 3.6% | 5.3% |
| Maximum | 68.9% | 100.0% |
| Range | 65.3% | 94.7% |
| Mean | 27.9% | 43.7% |
| Median | 29.0% | 37.4% |
| Interquartile 25% (IQ1) | 17.6% | 30.1% |
| Interquartile 75% (IQ3) | 34.6% | 53.5% |
| Interquartile Range (IQR) | 17.0% | 23.4% |
| Standard Deviation (Sample) | 13.3% | 22.3% |
| Standard Deviation (Population) | 13.2% | 22.1% |
Similar Demographics by Births to Unmarried Women
Demographics Similar to Iraqis by Births to Unmarried Women
In terms of births to unmarried women, the demographic groups most similar to Iraqis are Immigrants from Eastern Europe (27.6%, a difference of 0.020%), Immigrants from Bulgaria (27.6%, a difference of 0.24%), Turkish (27.4%, a difference of 0.41%), Immigrants from Indonesia (27.7%, a difference of 0.51%), and Latvian (27.7%, a difference of 0.60%).
| Demographics | Rating | Rank | Births to Unmarried Women |
| Immigrants | Pakistan | 99.8 /100 | #34 | Exceptional 27.2% |
| Immigrants | Ireland | 99.7 /100 | #35 | Exceptional 27.2% |
| Immigrants | Western Asia | 99.7 /100 | #36 | Exceptional 27.2% |
| Immigrants | Ukraine | 99.7 /100 | #37 | Exceptional 27.2% |
| Immigrants | Moldova | 99.7 /100 | #38 | Exceptional 27.3% |
| Immigrants | Malaysia | 99.7 /100 | #39 | Exceptional 27.4% |
| Turks | 99.6 /100 | #40 | Exceptional 27.4% |
| Iraqis | 99.6 /100 | #41 | Exceptional 27.6% |
| Immigrants | Eastern Europe | 99.6 /100 | #42 | Exceptional 27.6% |
| Immigrants | Bulgaria | 99.6 /100 | #43 | Exceptional 27.6% |
| Immigrants | Indonesia | 99.5 /100 | #44 | Exceptional 27.7% |
| Latvians | 99.5 /100 | #45 | Exceptional 27.7% |
| Immigrants | Lithuania | 99.5 /100 | #46 | Exceptional 27.7% |
| Hmong | 99.5 /100 | #47 | Exceptional 27.7% |
| Eastern Europeans | 99.5 /100 | #48 | Exceptional 27.7% |
Demographics Similar to Immigrants from Liberia by Births to Unmarried Women
In terms of births to unmarried women, the demographic groups most similar to Immigrants from Liberia are Creek (37.6%, a difference of 0.17%), Alaskan Athabascan (37.7%, a difference of 0.23%), Hispanic or Latino (37.8%, a difference of 0.37%), Immigrants from Guatemala (37.5%, a difference of 0.40%), and Immigrants from Mexico (37.5%, a difference of 0.41%).
| Demographics | Rating | Rank | Births to Unmarried Women |
| Immigrants | Belize | 0.1 /100 | #281 | Tragic 37.3% |
| Liberians | 0.0 /100 | #282 | Tragic 37.4% |
| Spanish American Indians | 0.0 /100 | #283 | Tragic 37.4% |
| Immigrants | Central America | 0.0 /100 | #284 | Tragic 37.4% |
| Immigrants | Mexico | 0.0 /100 | #285 | Tragic 37.5% |
| Immigrants | Guatemala | 0.0 /100 | #286 | Tragic 37.5% |
| Creek | 0.0 /100 | #287 | Tragic 37.6% |
| Immigrants | Liberia | 0.0 /100 | #288 | Tragic 37.6% |
| Alaskan Athabascans | 0.0 /100 | #289 | Tragic 37.7% |
| Hispanics or Latinos | 0.0 /100 | #290 | Tragic 37.8% |
| Seminole | 0.0 /100 | #291 | Tragic 37.9% |
| Blackfeet | 0.0 /100 | #292 | Tragic 37.9% |
| Immigrants | Nicaragua | 0.0 /100 | #293 | Tragic 38.0% |
| British West Indians | 0.0 /100 | #294 | Tragic 38.0% |
| Iroquois | 0.0 /100 | #295 | Tragic 38.2% |