Slovak vs Mongolian Married-couple Households
COMPARE
Slovak
Mongolian
Married-couple Households
Married-couple Households Comparison
Slovaks
Mongolians
47.6%
MARRIED-COUPLE HOUSEHOLDS
92.9/ 100
METRIC RATING
115th/ 347
METRIC RANK
46.3%
MARRIED-COUPLE HOUSEHOLDS
42.0/ 100
METRIC RATING
180th/ 347
METRIC RANK
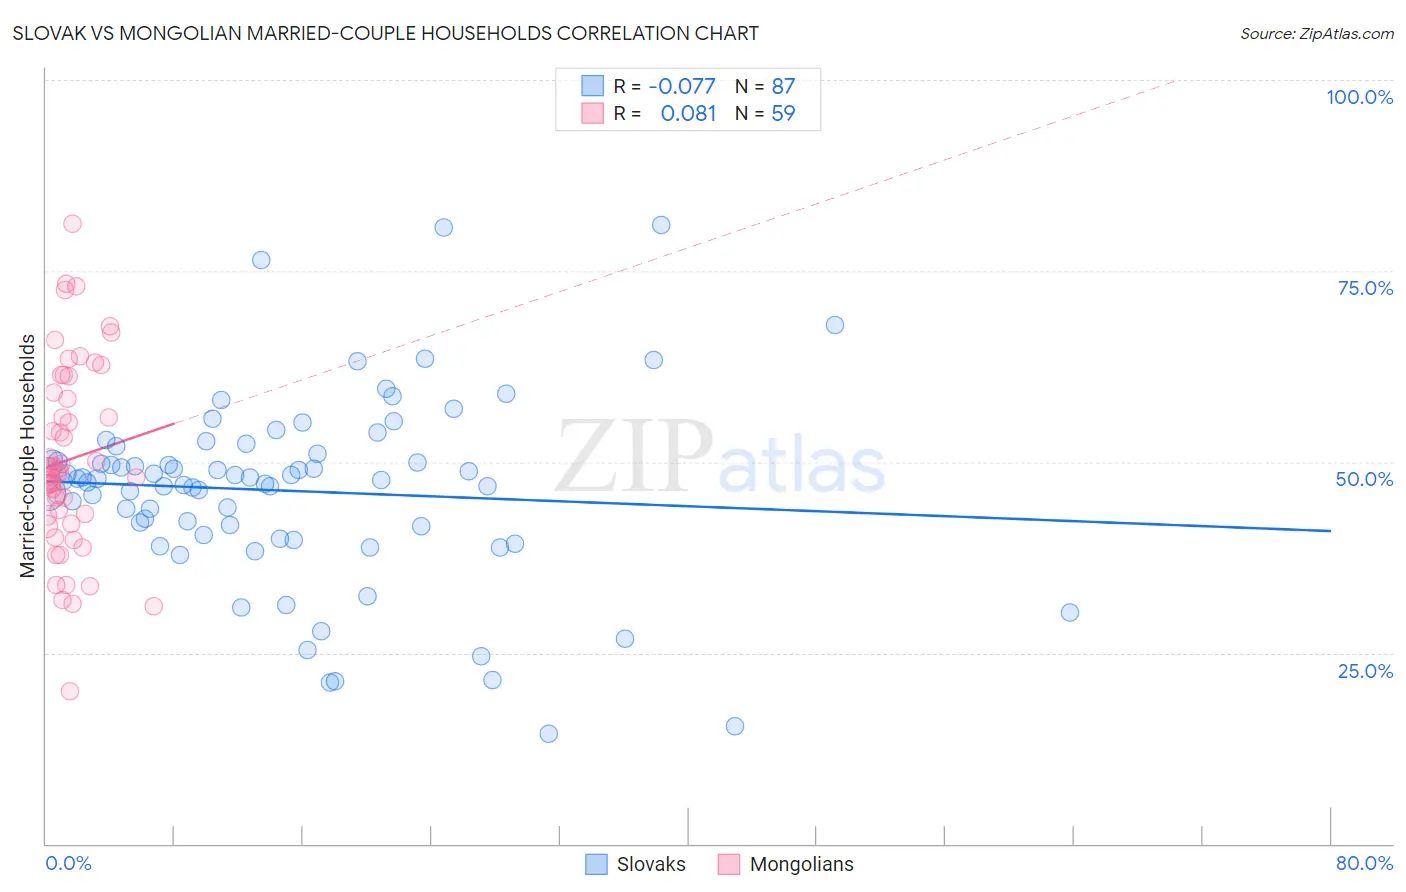
Slovak vs Mongolian Married-couple Households Correlation Chart
The statistical analysis conducted on geographies consisting of 397,658,026 people shows a slight negative correlation between the proportion of Slovaks and percentage of married-couple family households in the United States with a correlation coefficient (R) of -0.077 and weighted average of 47.6%. Similarly, the statistical analysis conducted on geographies consisting of 140,286,033 people shows a slight positive correlation between the proportion of Mongolians and percentage of married-couple family households in the United States with a correlation coefficient (R) of 0.081 and weighted average of 46.3%, a difference of 2.7%.
Married-couple Households Correlation Summary
| Measurement | Slovak | Mongolian |
| Minimum | 14.5% | 20.0% |
| Maximum | 81.0% | 81.2% |
| Range | 66.6% | 61.2% |
| Mean | 46.2% | 50.3% |
| Median | 47.7% | 48.6% |
| Interquartile 25% (IQ1) | 40.4% | 43.0% |
| Interquartile 75% (IQ3) | 51.1% | 59.1% |
| Interquartile Range (IQR) | 10.7% | 16.1% |
| Standard Deviation (Sample) | 12.3% | 12.1% |
| Standard Deviation (Population) | 12.3% | 12.0% |
Similar Demographics by Married-couple Households
Demographics Similar to Slovaks by Married-couple Households
In terms of married-couple households, the demographic groups most similar to Slovaks are Argentinean (47.5%, a difference of 0.050%), French Canadian (47.5%, a difference of 0.060%), Immigrants from Germany (47.5%, a difference of 0.070%), Chilean (47.5%, a difference of 0.10%), and Immigrants from Europe (47.6%, a difference of 0.12%).
| Demographics | Rating | Rank | Married-couple Households |
| Immigrants | Japan | 94.4 /100 | #108 | Exceptional 47.7% |
| Immigrants | Jordan | 94.1 /100 | #109 | Exceptional 47.7% |
| Macedonians | 93.9 /100 | #110 | Exceptional 47.6% |
| Syrians | 93.9 /100 | #111 | Exceptional 47.6% |
| Peruvians | 93.8 /100 | #112 | Exceptional 47.6% |
| Venezuelans | 93.8 /100 | #113 | Exceptional 47.6% |
| Immigrants | Europe | 93.7 /100 | #114 | Exceptional 47.6% |
| Slovaks | 92.9 /100 | #115 | Exceptional 47.6% |
| Argentineans | 92.5 /100 | #116 | Exceptional 47.5% |
| French Canadians | 92.4 /100 | #117 | Exceptional 47.5% |
| Immigrants | Germany | 92.4 /100 | #118 | Exceptional 47.5% |
| Chileans | 92.2 /100 | #119 | Exceptional 47.5% |
| Puget Sound Salish | 90.5 /100 | #120 | Exceptional 47.4% |
| Immigrants | Eastern Europe | 90.3 /100 | #121 | Exceptional 47.4% |
| Okinawans | 90.1 /100 | #122 | Exceptional 47.4% |
Demographics Similar to Mongolians by Married-couple Households
In terms of married-couple households, the demographic groups most similar to Mongolians are Malaysian (46.3%, a difference of 0.010%), Immigrants from Zimbabwe (46.3%, a difference of 0.040%), Immigrants from Costa Rica (46.3%, a difference of 0.050%), Immigrants (46.3%, a difference of 0.070%), and Cajun (46.4%, a difference of 0.12%).
| Demographics | Rating | Rank | Married-couple Households |
| Immigrants | Norway | 52.0 /100 | #173 | Average 46.5% |
| Immigrants | Mexico | 50.0 /100 | #174 | Average 46.4% |
| Immigrants | Colombia | 46.1 /100 | #175 | Average 46.4% |
| Cajuns | 45.2 /100 | #176 | Average 46.4% |
| Immigrants | Immigrants | 43.8 /100 | #177 | Average 46.3% |
| Immigrants | Costa Rica | 43.4 /100 | #178 | Average 46.3% |
| Immigrants | Zimbabwe | 43.0 /100 | #179 | Average 46.3% |
| Mongolians | 42.0 /100 | #180 | Average 46.3% |
| Malaysians | 41.8 /100 | #181 | Average 46.3% |
| Yugoslavians | 38.9 /100 | #182 | Fair 46.2% |
| Immigrants | Brazil | 38.3 /100 | #183 | Fair 46.2% |
| Immigrants | Switzerland | 36.9 /100 | #184 | Fair 46.2% |
| Brazilians | 35.9 /100 | #185 | Fair 46.2% |
| Albanians | 31.1 /100 | #186 | Fair 46.1% |
| Fijians | 29.2 /100 | #187 | Fair 46.1% |