Slovak vs Immigrants from France Married-couple Households
COMPARE
Slovak
Immigrants from France
Married-couple Households
Married-couple Households Comparison
Slovaks
Immigrants from France
47.6%
MARRIED-COUPLE HOUSEHOLDS
92.9/ 100
METRIC RATING
115th/ 347
METRIC RANK
45.4%
MARRIED-COUPLE HOUSEHOLDS
8.8/ 100
METRIC RATING
207th/ 347
METRIC RANK
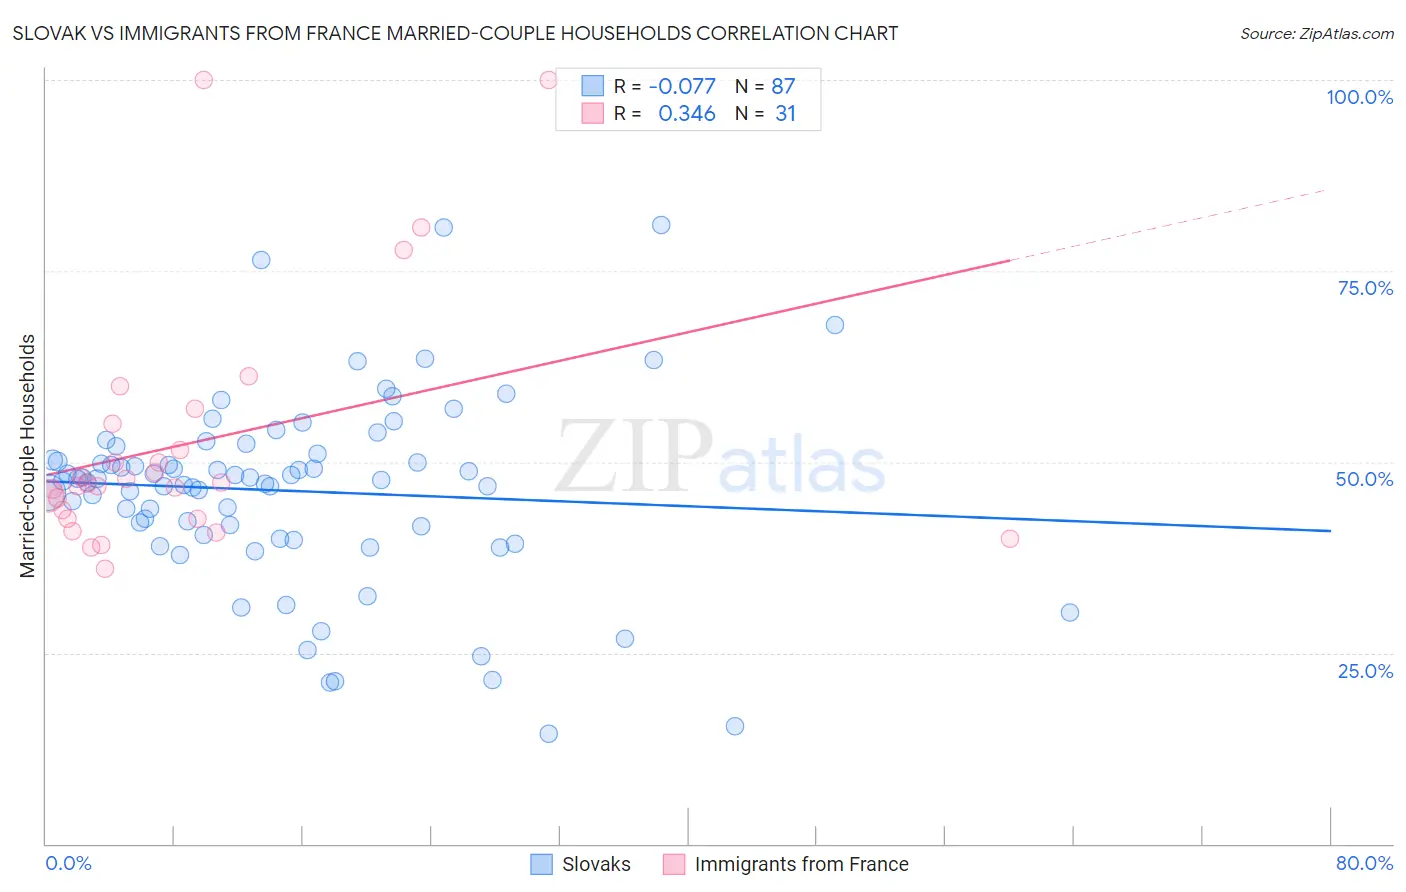
Slovak vs Immigrants from France Married-couple Households Correlation Chart
The statistical analysis conducted on geographies consisting of 397,658,026 people shows a slight negative correlation between the proportion of Slovaks and percentage of married-couple family households in the United States with a correlation coefficient (R) of -0.077 and weighted average of 47.6%. Similarly, the statistical analysis conducted on geographies consisting of 287,855,925 people shows a mild positive correlation between the proportion of Immigrants from France and percentage of married-couple family households in the United States with a correlation coefficient (R) of 0.346 and weighted average of 45.4%, a difference of 4.7%.
Married-couple Households Correlation Summary
| Measurement | Slovak | Immigrants from France |
| Minimum | 14.5% | 36.1% |
| Maximum | 81.0% | 100.0% |
| Range | 66.6% | 63.9% |
| Mean | 46.2% | 52.4% |
| Median | 47.7% | 47.2% |
| Interquartile 25% (IQ1) | 40.4% | 42.6% |
| Interquartile 75% (IQ3) | 51.1% | 54.9% |
| Interquartile Range (IQR) | 10.7% | 12.3% |
| Standard Deviation (Sample) | 12.3% | 16.1% |
| Standard Deviation (Population) | 12.3% | 15.9% |
Similar Demographics by Married-couple Households
Demographics Similar to Slovaks by Married-couple Households
In terms of married-couple households, the demographic groups most similar to Slovaks are Argentinean (47.5%, a difference of 0.050%), French Canadian (47.5%, a difference of 0.060%), Immigrants from Germany (47.5%, a difference of 0.070%), Chilean (47.5%, a difference of 0.10%), and Immigrants from Europe (47.6%, a difference of 0.12%).
| Demographics | Rating | Rank | Married-couple Households |
| Immigrants | Japan | 94.4 /100 | #108 | Exceptional 47.7% |
| Immigrants | Jordan | 94.1 /100 | #109 | Exceptional 47.7% |
| Macedonians | 93.9 /100 | #110 | Exceptional 47.6% |
| Syrians | 93.9 /100 | #111 | Exceptional 47.6% |
| Peruvians | 93.8 /100 | #112 | Exceptional 47.6% |
| Venezuelans | 93.8 /100 | #113 | Exceptional 47.6% |
| Immigrants | Europe | 93.7 /100 | #114 | Exceptional 47.6% |
| Slovaks | 92.9 /100 | #115 | Exceptional 47.6% |
| Argentineans | 92.5 /100 | #116 | Exceptional 47.5% |
| French Canadians | 92.4 /100 | #117 | Exceptional 47.5% |
| Immigrants | Germany | 92.4 /100 | #118 | Exceptional 47.5% |
| Chileans | 92.2 /100 | #119 | Exceptional 47.5% |
| Puget Sound Salish | 90.5 /100 | #120 | Exceptional 47.4% |
| Immigrants | Eastern Europe | 90.3 /100 | #121 | Exceptional 47.4% |
| Okinawans | 90.1 /100 | #122 | Exceptional 47.4% |
Demographics Similar to Immigrants from France by Married-couple Households
In terms of married-couple households, the demographic groups most similar to Immigrants from France are Hispanic or Latino (45.4%, a difference of 0.010%), Immigrants from Uzbekistan (45.4%, a difference of 0.050%), Cuban (45.4%, a difference of 0.14%), Uruguayan (45.5%, a difference of 0.18%), and Immigrants from Spain (45.3%, a difference of 0.19%).
| Demographics | Rating | Rank | Married-couple Households |
| Potawatomi | 15.6 /100 | #200 | Poor 45.7% |
| Immigrants | Serbia | 15.2 /100 | #201 | Poor 45.7% |
| Immigrants | Central America | 14.2 /100 | #202 | Poor 45.7% |
| Alaska Natives | 13.0 /100 | #203 | Poor 45.6% |
| Aleuts | 12.5 /100 | #204 | Poor 45.6% |
| Nepalese | 11.9 /100 | #205 | Poor 45.6% |
| Uruguayans | 10.4 /100 | #206 | Poor 45.5% |
| Immigrants | France | 8.8 /100 | #207 | Tragic 45.4% |
| Hispanics or Latinos | 8.7 /100 | #208 | Tragic 45.4% |
| Immigrants | Uzbekistan | 8.4 /100 | #209 | Tragic 45.4% |
| Cubans | 7.7 /100 | #210 | Tragic 45.4% |
| Immigrants | Spain | 7.3 /100 | #211 | Tragic 45.3% |
| Creek | 6.4 /100 | #212 | Tragic 45.3% |
| Yakama | 5.8 /100 | #213 | Tragic 45.2% |
| Japanese | 5.7 /100 | #214 | Tragic 45.2% |