Slovak vs Palestinian Married-couple Households
COMPARE
Slovak
Palestinian
Married-couple Households
Married-couple Households Comparison
Slovaks
Palestinians
47.6%
MARRIED-COUPLE HOUSEHOLDS
92.9/ 100
METRIC RATING
115th/ 347
METRIC RANK
48.0%
MARRIED-COUPLE HOUSEHOLDS
96.9/ 100
METRIC RATING
92nd/ 347
METRIC RANK
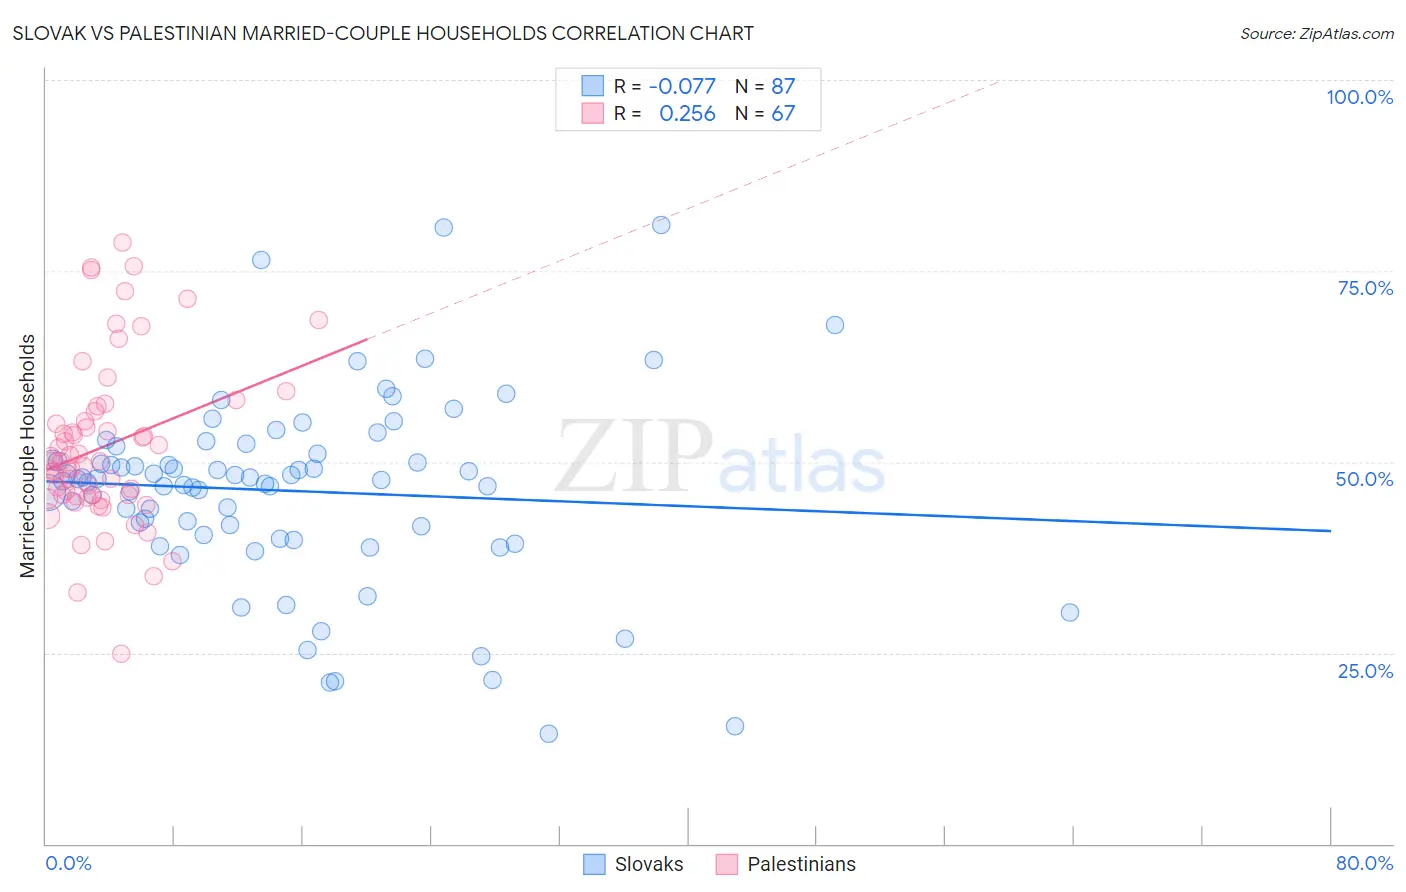
Slovak vs Palestinian Married-couple Households Correlation Chart
The statistical analysis conducted on geographies consisting of 397,658,026 people shows a slight negative correlation between the proportion of Slovaks and percentage of married-couple family households in the United States with a correlation coefficient (R) of -0.077 and weighted average of 47.6%. Similarly, the statistical analysis conducted on geographies consisting of 216,389,787 people shows a weak positive correlation between the proportion of Palestinians and percentage of married-couple family households in the United States with a correlation coefficient (R) of 0.256 and weighted average of 48.0%, a difference of 0.81%.
Married-couple Households Correlation Summary
| Measurement | Slovak | Palestinian |
| Minimum | 14.5% | 24.9% |
| Maximum | 81.0% | 78.7% |
| Range | 66.6% | 53.9% |
| Mean | 46.2% | 52.0% |
| Median | 47.7% | 50.1% |
| Interquartile 25% (IQ1) | 40.4% | 45.5% |
| Interquartile 75% (IQ3) | 51.1% | 56.6% |
| Interquartile Range (IQR) | 10.7% | 11.1% |
| Standard Deviation (Sample) | 12.3% | 10.7% |
| Standard Deviation (Population) | 12.3% | 10.6% |
Similar Demographics by Married-couple Households
Demographics Similar to Slovaks by Married-couple Households
In terms of married-couple households, the demographic groups most similar to Slovaks are Argentinean (47.5%, a difference of 0.050%), French Canadian (47.5%, a difference of 0.060%), Immigrants from Germany (47.5%, a difference of 0.070%), Chilean (47.5%, a difference of 0.10%), and Immigrants from Europe (47.6%, a difference of 0.12%).
| Demographics | Rating | Rank | Married-couple Households |
| Immigrants | Japan | 94.4 /100 | #108 | Exceptional 47.7% |
| Immigrants | Jordan | 94.1 /100 | #109 | Exceptional 47.7% |
| Macedonians | 93.9 /100 | #110 | Exceptional 47.6% |
| Syrians | 93.9 /100 | #111 | Exceptional 47.6% |
| Peruvians | 93.8 /100 | #112 | Exceptional 47.6% |
| Venezuelans | 93.8 /100 | #113 | Exceptional 47.6% |
| Immigrants | Europe | 93.7 /100 | #114 | Exceptional 47.6% |
| Slovaks | 92.9 /100 | #115 | Exceptional 47.6% |
| Argentineans | 92.5 /100 | #116 | Exceptional 47.5% |
| French Canadians | 92.4 /100 | #117 | Exceptional 47.5% |
| Immigrants | Germany | 92.4 /100 | #118 | Exceptional 47.5% |
| Chileans | 92.2 /100 | #119 | Exceptional 47.5% |
| Puget Sound Salish | 90.5 /100 | #120 | Exceptional 47.4% |
| Immigrants | Eastern Europe | 90.3 /100 | #121 | Exceptional 47.4% |
| Okinawans | 90.1 /100 | #122 | Exceptional 47.4% |
Demographics Similar to Palestinians by Married-couple Households
In terms of married-couple households, the demographic groups most similar to Palestinians are Immigrants from Moldova (48.0%, a difference of 0.020%), Lebanese (47.9%, a difference of 0.020%), American (47.9%, a difference of 0.020%), Immigrants from Belgium (47.9%, a difference of 0.060%), and French (48.0%, a difference of 0.080%).
| Demographics | Rating | Rank | Married-couple Households |
| Immigrants | Israel | 97.4 /100 | #85 | Exceptional 48.0% |
| Belgians | 97.4 /100 | #86 | Exceptional 48.0% |
| Immigrants | Ireland | 97.3 /100 | #87 | Exceptional 48.0% |
| Afghans | 97.3 /100 | #88 | Exceptional 48.0% |
| Cypriots | 97.2 /100 | #89 | Exceptional 48.0% |
| French | 97.2 /100 | #90 | Exceptional 48.0% |
| Immigrants | Moldova | 97.0 /100 | #91 | Exceptional 48.0% |
| Palestinians | 96.9 /100 | #92 | Exceptional 48.0% |
| Lebanese | 96.9 /100 | #93 | Exceptional 47.9% |
| Americans | 96.9 /100 | #94 | Exceptional 47.9% |
| Immigrants | Belgium | 96.8 /100 | #95 | Exceptional 47.9% |
| Immigrants | Egypt | 96.6 /100 | #96 | Exceptional 47.9% |
| Latvians | 96.5 /100 | #97 | Exceptional 47.9% |
| Immigrants | North Macedonia | 96.4 /100 | #98 | Exceptional 47.9% |
| Immigrants | Austria | 96.4 /100 | #99 | Exceptional 47.9% |