Osage vs Mongolian Married-couple Households
COMPARE
Osage
Mongolian
Married-couple Households
Married-couple Households Comparison
Osage
Mongolians
46.9%
MARRIED-COUPLE HOUSEHOLDS
73.2/ 100
METRIC RATING
159th/ 347
METRIC RANK
46.3%
MARRIED-COUPLE HOUSEHOLDS
42.0/ 100
METRIC RATING
180th/ 347
METRIC RANK
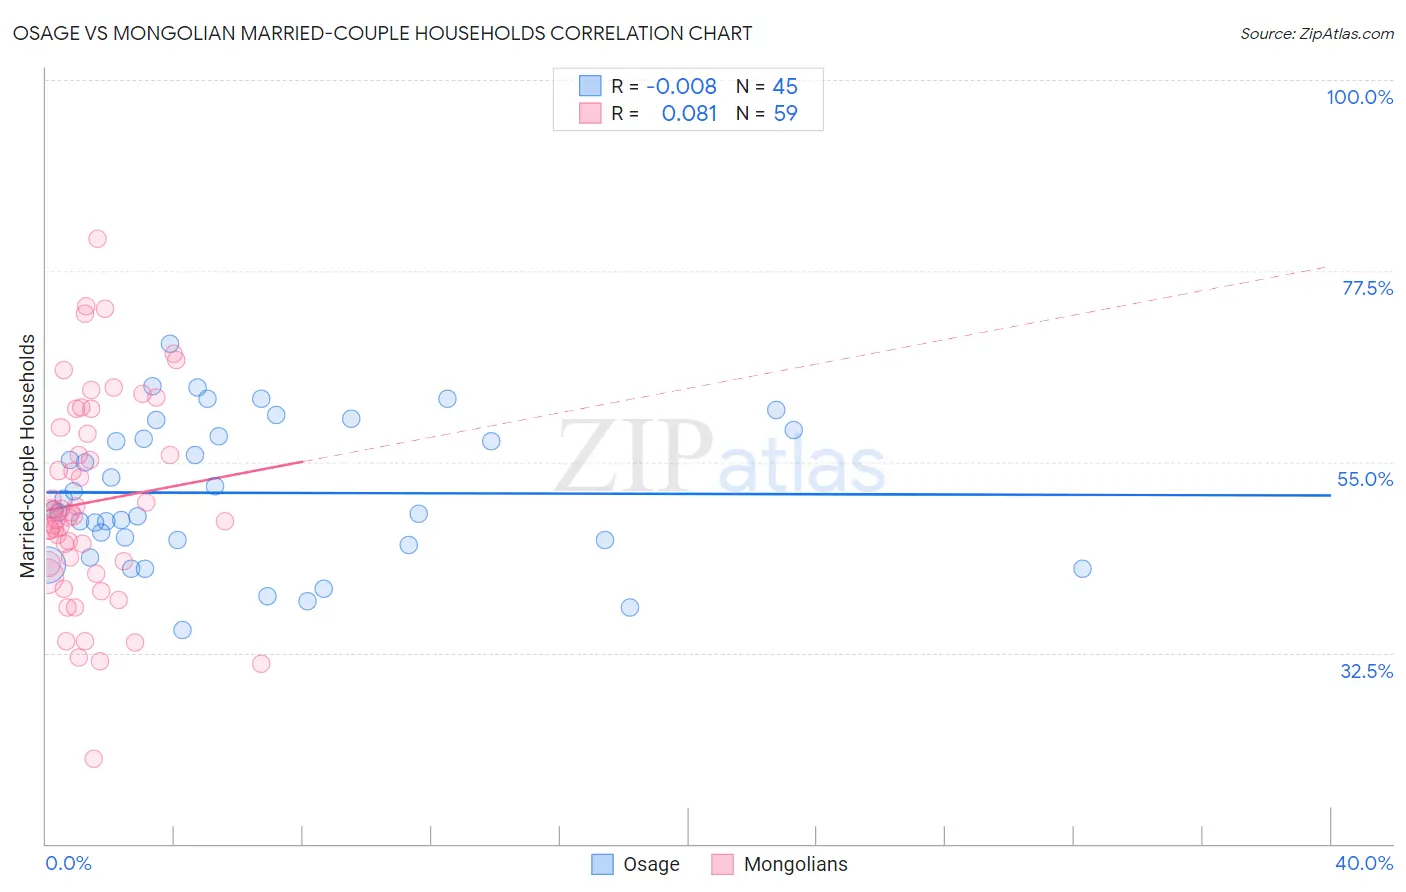
Osage vs Mongolian Married-couple Households Correlation Chart
The statistical analysis conducted on geographies consisting of 91,797,548 people shows no correlation between the proportion of Osage and percentage of married-couple family households in the United States with a correlation coefficient (R) of -0.008 and weighted average of 46.9%. Similarly, the statistical analysis conducted on geographies consisting of 140,286,033 people shows a slight positive correlation between the proportion of Mongolians and percentage of married-couple family households in the United States with a correlation coefficient (R) of 0.081 and weighted average of 46.3%, a difference of 1.3%.
Married-couple Households Correlation Summary
| Measurement | Osage | Mongolian |
| Minimum | 35.1% | 20.0% |
| Maximum | 68.9% | 81.2% |
| Range | 33.8% | 61.2% |
| Mean | 51.3% | 50.3% |
| Median | 49.4% | 48.6% |
| Interquartile 25% (IQ1) | 45.5% | 43.0% |
| Interquartile 75% (IQ3) | 58.3% | 59.1% |
| Interquartile Range (IQR) | 12.9% | 16.1% |
| Standard Deviation (Sample) | 8.3% | 12.1% |
| Standard Deviation (Population) | 8.2% | 12.0% |
Similar Demographics by Married-couple Households
Demographics Similar to Osage by Married-couple Households
In terms of married-couple households, the demographic groups most similar to Osage are Nonimmigrants (46.9%, a difference of 0.0%), Iraqi (46.9%, a difference of 0.070%), Immigrants from Oceania (46.9%, a difference of 0.080%), Delaware (46.8%, a difference of 0.090%), and Armenian (46.9%, a difference of 0.10%).
| Demographics | Rating | Rank | Married-couple Households |
| Serbians | 76.3 /100 | #152 | Good 47.0% |
| Hmong | 76.2 /100 | #153 | Good 47.0% |
| Immigrants | Western Asia | 76.1 /100 | #154 | Good 46.9% |
| Arabs | 76.0 /100 | #155 | Good 46.9% |
| Armenians | 75.4 /100 | #156 | Good 46.9% |
| Immigrants | Oceania | 74.8 /100 | #157 | Good 46.9% |
| Immigrants | Nonimmigrants | 73.3 /100 | #158 | Good 46.9% |
| Osage | 73.2 /100 | #159 | Good 46.9% |
| Iraqis | 71.7 /100 | #160 | Good 46.9% |
| Delaware | 71.2 /100 | #161 | Good 46.8% |
| Colombians | 71.0 /100 | #162 | Good 46.8% |
| Immigrants | Turkey | 70.2 /100 | #163 | Good 46.8% |
| Immigrants | Kazakhstan | 70.0 /100 | #164 | Good 46.8% |
| Immigrants | Southern Europe | 69.9 /100 | #165 | Good 46.8% |
| Cherokee | 65.7 /100 | #166 | Good 46.7% |
Demographics Similar to Mongolians by Married-couple Households
In terms of married-couple households, the demographic groups most similar to Mongolians are Malaysian (46.3%, a difference of 0.010%), Immigrants from Zimbabwe (46.3%, a difference of 0.040%), Immigrants from Costa Rica (46.3%, a difference of 0.050%), Immigrants (46.3%, a difference of 0.070%), and Cajun (46.4%, a difference of 0.12%).
| Demographics | Rating | Rank | Married-couple Households |
| Immigrants | Norway | 52.0 /100 | #173 | Average 46.5% |
| Immigrants | Mexico | 50.0 /100 | #174 | Average 46.4% |
| Immigrants | Colombia | 46.1 /100 | #175 | Average 46.4% |
| Cajuns | 45.2 /100 | #176 | Average 46.4% |
| Immigrants | Immigrants | 43.8 /100 | #177 | Average 46.3% |
| Immigrants | Costa Rica | 43.4 /100 | #178 | Average 46.3% |
| Immigrants | Zimbabwe | 43.0 /100 | #179 | Average 46.3% |
| Mongolians | 42.0 /100 | #180 | Average 46.3% |
| Malaysians | 41.8 /100 | #181 | Average 46.3% |
| Yugoslavians | 38.9 /100 | #182 | Fair 46.2% |
| Immigrants | Brazil | 38.3 /100 | #183 | Fair 46.2% |
| Immigrants | Switzerland | 36.9 /100 | #184 | Fair 46.2% |
| Brazilians | 35.9 /100 | #185 | Fair 46.2% |
| Albanians | 31.1 /100 | #186 | Fair 46.1% |
| Fijians | 29.2 /100 | #187 | Fair 46.1% |