Immigrants from Cabo Verde vs Mongolian Married-couple Households
COMPARE
Immigrants from Cabo Verde
Mongolian
Married-couple Households
Married-couple Households Comparison
Immigrants from Cabo Verde
Mongolians
36.2%
MARRIED-COUPLE HOUSEHOLDS
0.0/ 100
METRIC RATING
346th/ 347
METRIC RANK
46.3%
MARRIED-COUPLE HOUSEHOLDS
42.0/ 100
METRIC RATING
180th/ 347
METRIC RANK
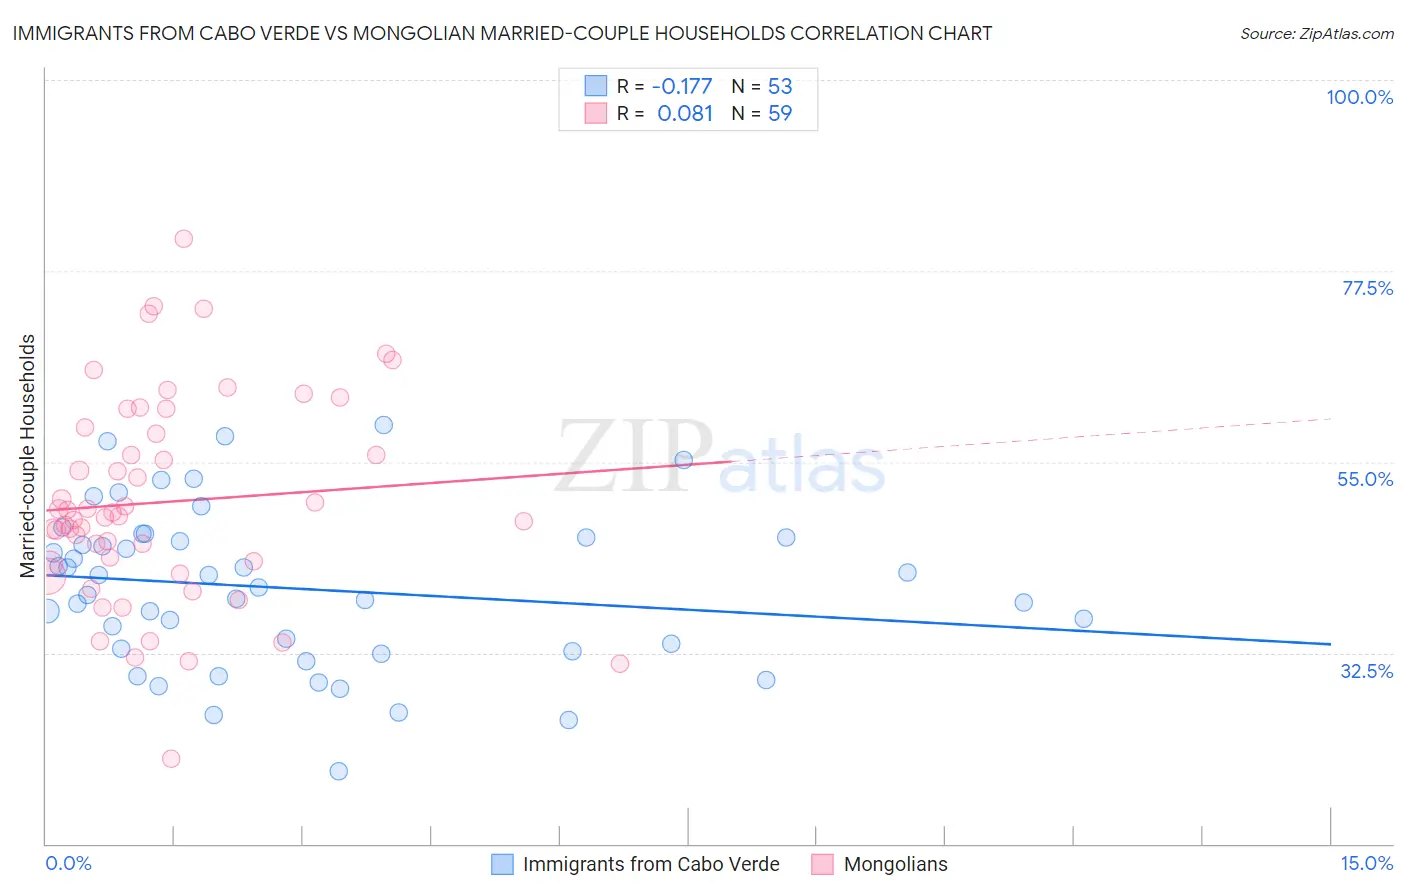
Immigrants from Cabo Verde vs Mongolian Married-couple Households Correlation Chart
The statistical analysis conducted on geographies consisting of 38,131,070 people shows a poor negative correlation between the proportion of Immigrants from Cabo Verde and percentage of married-couple family households in the United States with a correlation coefficient (R) of -0.177 and weighted average of 36.2%. Similarly, the statistical analysis conducted on geographies consisting of 140,286,033 people shows a slight positive correlation between the proportion of Mongolians and percentage of married-couple family households in the United States with a correlation coefficient (R) of 0.081 and weighted average of 46.3%, a difference of 27.8%.
Married-couple Households Correlation Summary
| Measurement | Immigrants from Cabo Verde | Mongolian |
| Minimum | 18.5% | 20.0% |
| Maximum | 59.3% | 81.2% |
| Range | 40.8% | 61.2% |
| Mean | 40.1% | 50.3% |
| Median | 40.1% | 48.6% |
| Interquartile 25% (IQ1) | 32.9% | 43.0% |
| Interquartile 75% (IQ3) | 46.1% | 59.1% |
| Interquartile Range (IQR) | 13.2% | 16.1% |
| Standard Deviation (Sample) | 9.3% | 12.1% |
| Standard Deviation (Population) | 9.2% | 12.0% |
Similar Demographics by Married-couple Households
Demographics Similar to Immigrants from Cabo Verde by Married-couple Households
In terms of married-couple households, the demographic groups most similar to Immigrants from Cabo Verde are Hopi (36.7%, a difference of 1.2%), Pima (35.6%, a difference of 1.9%), Immigrants from Dominican Republic (37.3%, a difference of 3.0%), Immigrants from Grenada (37.5%, a difference of 3.5%), and Tohono O'odham (37.9%, a difference of 4.6%).
| Demographics | Rating | Rank | Married-couple Households |
| Immigrants | West Indies | 0.0 /100 | #333 | Tragic 39.0% |
| Immigrants | St. Vincent and the Grenadines | 0.0 /100 | #334 | Tragic 38.7% |
| Senegalese | 0.0 /100 | #335 | Tragic 38.6% |
| Blacks/African Americans | 0.0 /100 | #336 | Tragic 38.5% |
| Immigrants | Somalia | 0.0 /100 | #337 | Tragic 38.4% |
| Immigrants | Senegal | 0.0 /100 | #338 | Tragic 38.4% |
| British West Indians | 0.0 /100 | #339 | Tragic 38.3% |
| Dominicans | 0.0 /100 | #340 | Tragic 38.2% |
| Cape Verdeans | 0.0 /100 | #341 | Tragic 38.1% |
| Tohono O'odham | 0.0 /100 | #342 | Tragic 37.9% |
| Immigrants | Grenada | 0.0 /100 | #343 | Tragic 37.5% |
| Immigrants | Dominican Republic | 0.0 /100 | #344 | Tragic 37.3% |
| Hopi | 0.0 /100 | #345 | Tragic 36.7% |
| Immigrants | Cabo Verde | 0.0 /100 | #346 | Tragic 36.2% |
| Pima | 0.0 /100 | #347 | Tragic 35.6% |
Demographics Similar to Mongolians by Married-couple Households
In terms of married-couple households, the demographic groups most similar to Mongolians are Malaysian (46.3%, a difference of 0.010%), Immigrants from Zimbabwe (46.3%, a difference of 0.040%), Immigrants from Costa Rica (46.3%, a difference of 0.050%), Immigrants (46.3%, a difference of 0.070%), and Cajun (46.4%, a difference of 0.12%).
| Demographics | Rating | Rank | Married-couple Households |
| Immigrants | Norway | 52.0 /100 | #173 | Average 46.5% |
| Immigrants | Mexico | 50.0 /100 | #174 | Average 46.4% |
| Immigrants | Colombia | 46.1 /100 | #175 | Average 46.4% |
| Cajuns | 45.2 /100 | #176 | Average 46.4% |
| Immigrants | Immigrants | 43.8 /100 | #177 | Average 46.3% |
| Immigrants | Costa Rica | 43.4 /100 | #178 | Average 46.3% |
| Immigrants | Zimbabwe | 43.0 /100 | #179 | Average 46.3% |
| Mongolians | 42.0 /100 | #180 | Average 46.3% |
| Malaysians | 41.8 /100 | #181 | Average 46.3% |
| Yugoslavians | 38.9 /100 | #182 | Fair 46.2% |
| Immigrants | Brazil | 38.3 /100 | #183 | Fair 46.2% |
| Immigrants | Switzerland | 36.9 /100 | #184 | Fair 46.2% |
| Brazilians | 35.9 /100 | #185 | Fair 46.2% |
| Albanians | 31.1 /100 | #186 | Fair 46.1% |
| Fijians | 29.2 /100 | #187 | Fair 46.1% |