Immigrants from Micronesia vs Mongolian Married-couple Households
COMPARE
Immigrants from Micronesia
Mongolian
Married-couple Households
Married-couple Households Comparison
Immigrants from Micronesia
Mongolians
44.9%
MARRIED-COUPLE HOUSEHOLDS
2.6/ 100
METRIC RATING
224th/ 347
METRIC RANK
46.3%
MARRIED-COUPLE HOUSEHOLDS
42.0/ 100
METRIC RATING
180th/ 347
METRIC RANK
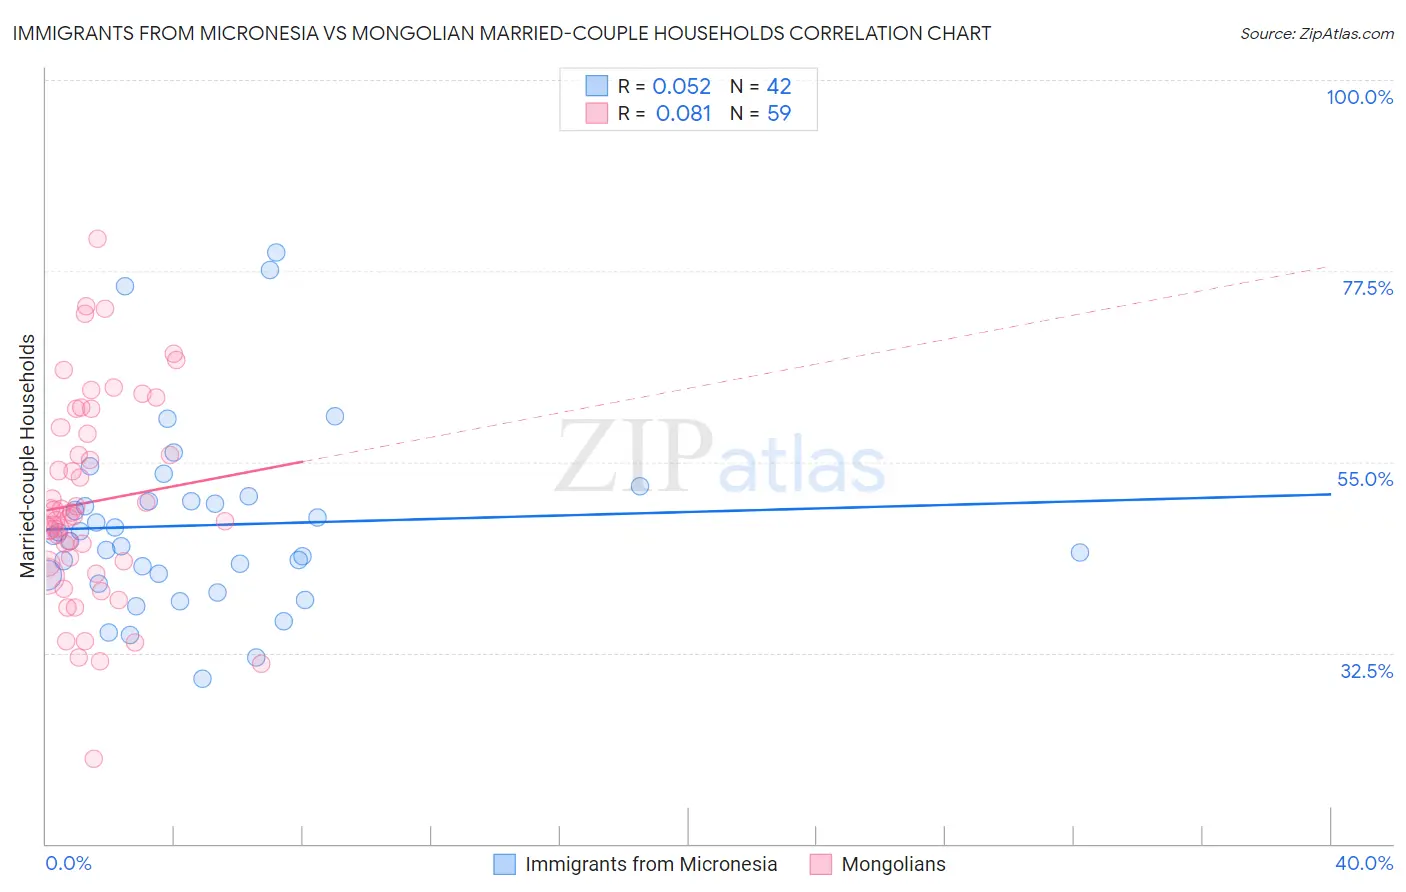
Immigrants from Micronesia vs Mongolian Married-couple Households Correlation Chart
The statistical analysis conducted on geographies consisting of 61,600,267 people shows a slight positive correlation between the proportion of Immigrants from Micronesia and percentage of married-couple family households in the United States with a correlation coefficient (R) of 0.052 and weighted average of 44.9%. Similarly, the statistical analysis conducted on geographies consisting of 140,286,033 people shows a slight positive correlation between the proportion of Mongolians and percentage of married-couple family households in the United States with a correlation coefficient (R) of 0.081 and weighted average of 46.3%, a difference of 3.2%.
Married-couple Households Correlation Summary
| Measurement | Immigrants from Micronesia | Mongolian |
| Minimum | 29.5% | 20.0% |
| Maximum | 79.7% | 81.2% |
| Range | 50.3% | 61.2% |
| Mean | 47.5% | 50.3% |
| Median | 45.9% | 48.6% |
| Interquartile 25% (IQ1) | 41.7% | 43.0% |
| Interquartile 75% (IQ3) | 50.4% | 59.1% |
| Interquartile Range (IQR) | 8.7% | 16.1% |
| Standard Deviation (Sample) | 10.9% | 12.1% |
| Standard Deviation (Population) | 10.7% | 12.0% |
Similar Demographics by Married-couple Households
Demographics Similar to Immigrants from Micronesia by Married-couple Households
In terms of married-couple households, the demographic groups most similar to Immigrants from Micronesia are Dutch West Indian (44.9%, a difference of 0.020%), Immigrants from Cambodia (44.9%, a difference of 0.030%), Alsatian (44.8%, a difference of 0.12%), Salvadoran (44.7%, a difference of 0.31%), and Kenyan (44.7%, a difference of 0.43%).
| Demographics | Rating | Rank | Married-couple Households |
| Panamanians | 5.5 /100 | #217 | Tragic 45.2% |
| Immigrants | Azores | 5.3 /100 | #218 | Tragic 45.2% |
| Nicaraguans | 5.3 /100 | #219 | Tragic 45.2% |
| Immigrants | Thailand | 5.1 /100 | #220 | Tragic 45.2% |
| Tlingit-Haida | 4.9 /100 | #221 | Tragic 45.1% |
| Immigrants | Laos | 4.6 /100 | #222 | Tragic 45.1% |
| Immigrants | Cambodia | 2.7 /100 | #223 | Tragic 44.9% |
| Immigrants | Micronesia | 2.6 /100 | #224 | Tragic 44.9% |
| Dutch West Indians | 2.6 /100 | #225 | Tragic 44.9% |
| Alsatians | 2.3 /100 | #226 | Tragic 44.8% |
| Salvadorans | 1.9 /100 | #227 | Tragic 44.7% |
| Kenyans | 1.7 /100 | #228 | Tragic 44.7% |
| Immigrants | Latin America | 1.6 /100 | #229 | Tragic 44.7% |
| Soviet Union | 1.6 /100 | #230 | Tragic 44.6% |
| Houma | 1.5 /100 | #231 | Tragic 44.6% |
Demographics Similar to Mongolians by Married-couple Households
In terms of married-couple households, the demographic groups most similar to Mongolians are Malaysian (46.3%, a difference of 0.010%), Immigrants from Zimbabwe (46.3%, a difference of 0.040%), Immigrants from Costa Rica (46.3%, a difference of 0.050%), Immigrants (46.3%, a difference of 0.070%), and Cajun (46.4%, a difference of 0.12%).
| Demographics | Rating | Rank | Married-couple Households |
| Immigrants | Norway | 52.0 /100 | #173 | Average 46.5% |
| Immigrants | Mexico | 50.0 /100 | #174 | Average 46.4% |
| Immigrants | Colombia | 46.1 /100 | #175 | Average 46.4% |
| Cajuns | 45.2 /100 | #176 | Average 46.4% |
| Immigrants | Immigrants | 43.8 /100 | #177 | Average 46.3% |
| Immigrants | Costa Rica | 43.4 /100 | #178 | Average 46.3% |
| Immigrants | Zimbabwe | 43.0 /100 | #179 | Average 46.3% |
| Mongolians | 42.0 /100 | #180 | Average 46.3% |
| Malaysians | 41.8 /100 | #181 | Average 46.3% |
| Yugoslavians | 38.9 /100 | #182 | Fair 46.2% |
| Immigrants | Brazil | 38.3 /100 | #183 | Fair 46.2% |
| Immigrants | Switzerland | 36.9 /100 | #184 | Fair 46.2% |
| Brazilians | 35.9 /100 | #185 | Fair 46.2% |
| Albanians | 31.1 /100 | #186 | Fair 46.1% |
| Fijians | 29.2 /100 | #187 | Fair 46.1% |