Uruguayan vs Mongolian Married-couple Households
COMPARE
Uruguayan
Mongolian
Married-couple Households
Married-couple Households Comparison
Uruguayans
Mongolians
45.5%
MARRIED-COUPLE HOUSEHOLDS
10.4/ 100
METRIC RATING
206th/ 347
METRIC RANK
46.3%
MARRIED-COUPLE HOUSEHOLDS
42.0/ 100
METRIC RATING
180th/ 347
METRIC RANK
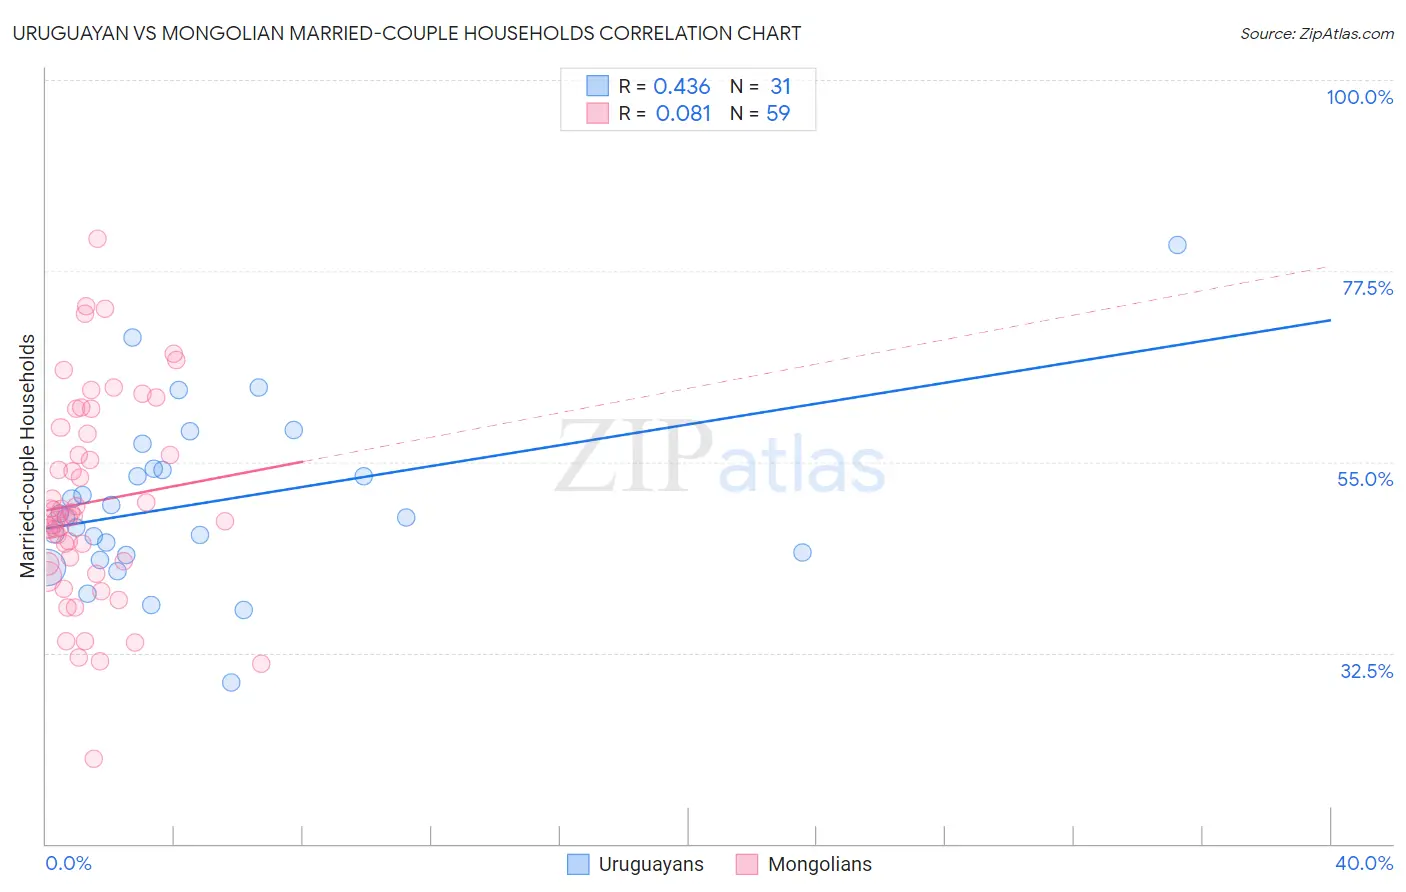
Uruguayan vs Mongolian Married-couple Households Correlation Chart
The statistical analysis conducted on geographies consisting of 144,757,843 people shows a moderate positive correlation between the proportion of Uruguayans and percentage of married-couple family households in the United States with a correlation coefficient (R) of 0.436 and weighted average of 45.5%. Similarly, the statistical analysis conducted on geographies consisting of 140,286,033 people shows a slight positive correlation between the proportion of Mongolians and percentage of married-couple family households in the United States with a correlation coefficient (R) of 0.081 and weighted average of 46.3%, a difference of 1.8%.
Married-couple Households Correlation Summary
| Measurement | Uruguayan | Mongolian |
| Minimum | 29.0% | 20.0% |
| Maximum | 80.5% | 81.2% |
| Range | 51.4% | 61.2% |
| Mean | 50.2% | 50.3% |
| Median | 48.5% | 48.6% |
| Interquartile 25% (IQ1) | 44.0% | 43.0% |
| Interquartile 75% (IQ3) | 54.2% | 59.1% |
| Interquartile Range (IQR) | 10.2% | 16.1% |
| Standard Deviation (Sample) | 10.2% | 12.1% |
| Standard Deviation (Population) | 10.0% | 12.0% |
Similar Demographics by Married-couple Households
Demographics Similar to Uruguayans by Married-couple Households
In terms of married-couple households, the demographic groups most similar to Uruguayans are Nepalese (45.6%, a difference of 0.14%), Immigrants from France (45.4%, a difference of 0.18%), Hispanic or Latino (45.4%, a difference of 0.19%), Aleut (45.6%, a difference of 0.20%), and Immigrants from Uzbekistan (45.4%, a difference of 0.23%).
| Demographics | Rating | Rank | Married-couple Households |
| Carpatho Rusyns | 15.7 /100 | #199 | Poor 45.7% |
| Potawatomi | 15.6 /100 | #200 | Poor 45.7% |
| Immigrants | Serbia | 15.2 /100 | #201 | Poor 45.7% |
| Immigrants | Central America | 14.2 /100 | #202 | Poor 45.7% |
| Alaska Natives | 13.0 /100 | #203 | Poor 45.6% |
| Aleuts | 12.5 /100 | #204 | Poor 45.6% |
| Nepalese | 11.9 /100 | #205 | Poor 45.6% |
| Uruguayans | 10.4 /100 | #206 | Poor 45.5% |
| Immigrants | France | 8.8 /100 | #207 | Tragic 45.4% |
| Hispanics or Latinos | 8.7 /100 | #208 | Tragic 45.4% |
| Immigrants | Uzbekistan | 8.4 /100 | #209 | Tragic 45.4% |
| Cubans | 7.7 /100 | #210 | Tragic 45.4% |
| Immigrants | Spain | 7.3 /100 | #211 | Tragic 45.3% |
| Creek | 6.4 /100 | #212 | Tragic 45.3% |
| Yakama | 5.8 /100 | #213 | Tragic 45.2% |
Demographics Similar to Mongolians by Married-couple Households
In terms of married-couple households, the demographic groups most similar to Mongolians are Malaysian (46.3%, a difference of 0.010%), Immigrants from Zimbabwe (46.3%, a difference of 0.040%), Immigrants from Costa Rica (46.3%, a difference of 0.050%), Immigrants (46.3%, a difference of 0.070%), and Cajun (46.4%, a difference of 0.12%).
| Demographics | Rating | Rank | Married-couple Households |
| Immigrants | Norway | 52.0 /100 | #173 | Average 46.5% |
| Immigrants | Mexico | 50.0 /100 | #174 | Average 46.4% |
| Immigrants | Colombia | 46.1 /100 | #175 | Average 46.4% |
| Cajuns | 45.2 /100 | #176 | Average 46.4% |
| Immigrants | Immigrants | 43.8 /100 | #177 | Average 46.3% |
| Immigrants | Costa Rica | 43.4 /100 | #178 | Average 46.3% |
| Immigrants | Zimbabwe | 43.0 /100 | #179 | Average 46.3% |
| Mongolians | 42.0 /100 | #180 | Average 46.3% |
| Malaysians | 41.8 /100 | #181 | Average 46.3% |
| Yugoslavians | 38.9 /100 | #182 | Fair 46.2% |
| Immigrants | Brazil | 38.3 /100 | #183 | Fair 46.2% |
| Immigrants | Switzerland | 36.9 /100 | #184 | Fair 46.2% |
| Brazilians | 35.9 /100 | #185 | Fair 46.2% |
| Albanians | 31.1 /100 | #186 | Fair 46.1% |
| Fijians | 29.2 /100 | #187 | Fair 46.1% |