Spanish vs Mongolian Married-couple Households
COMPARE
Spanish
Mongolian
Married-couple Households
Married-couple Households Comparison
Spanish
Mongolians
47.2%
MARRIED-COUPLE HOUSEHOLDS
84.5/ 100
METRIC RATING
140th/ 347
METRIC RANK
46.3%
MARRIED-COUPLE HOUSEHOLDS
42.0/ 100
METRIC RATING
180th/ 347
METRIC RANK
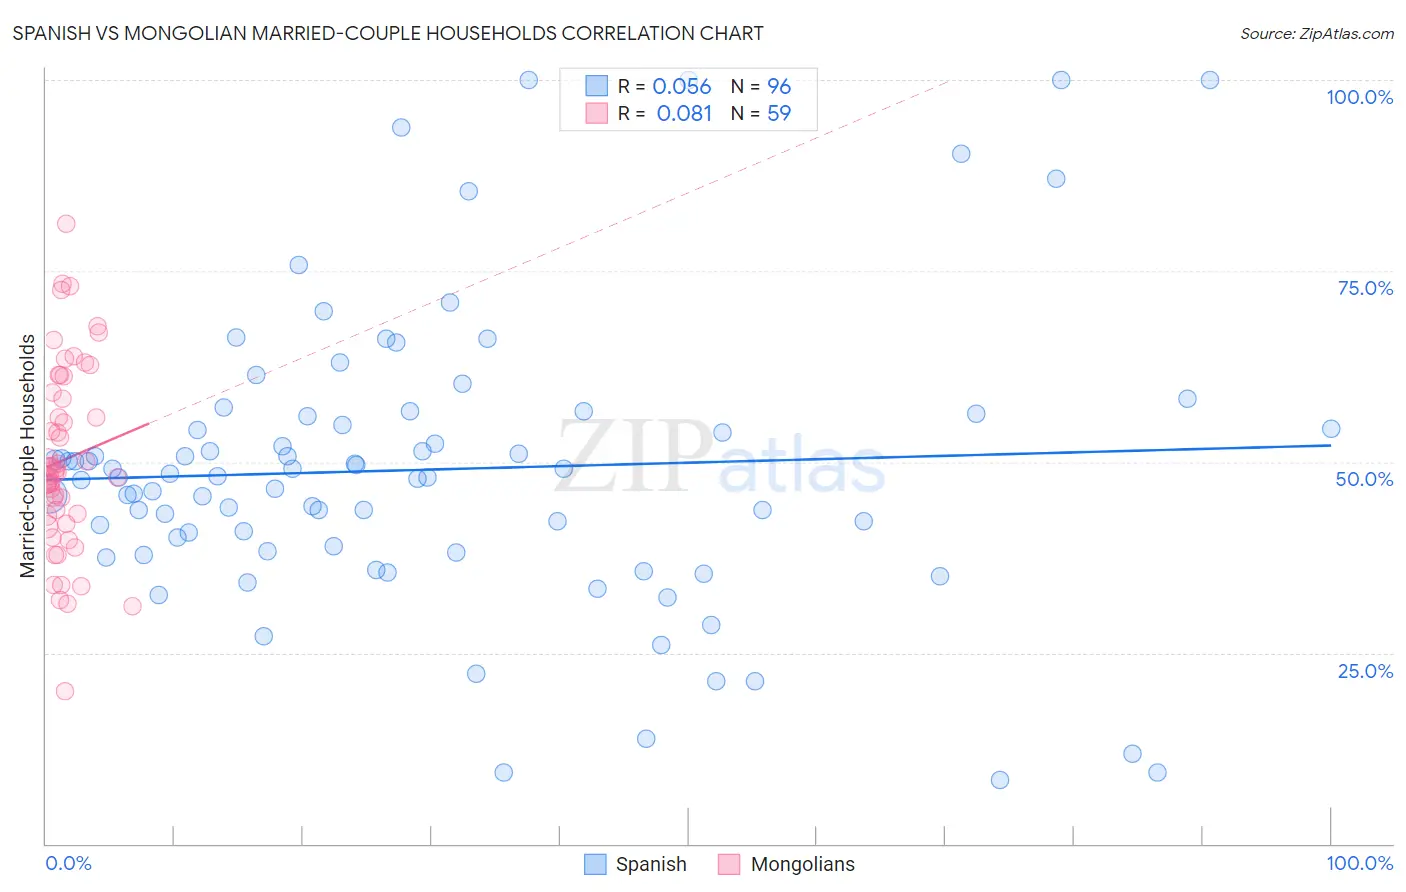
Spanish vs Mongolian Married-couple Households Correlation Chart
The statistical analysis conducted on geographies consisting of 421,907,017 people shows a slight positive correlation between the proportion of Spanish and percentage of married-couple family households in the United States with a correlation coefficient (R) of 0.056 and weighted average of 47.2%. Similarly, the statistical analysis conducted on geographies consisting of 140,286,033 people shows a slight positive correlation between the proportion of Mongolians and percentage of married-couple family households in the United States with a correlation coefficient (R) of 0.081 and weighted average of 46.3%, a difference of 1.9%.
Married-couple Households Correlation Summary
| Measurement | Spanish | Mongolian |
| Minimum | 8.3% | 20.0% |
| Maximum | 100.0% | 81.2% |
| Range | 91.7% | 61.2% |
| Mean | 49.0% | 50.3% |
| Median | 48.0% | 48.6% |
| Interquartile 25% (IQ1) | 38.6% | 43.0% |
| Interquartile 75% (IQ3) | 55.4% | 59.1% |
| Interquartile Range (IQR) | 16.8% | 16.1% |
| Standard Deviation (Sample) | 19.2% | 12.1% |
| Standard Deviation (Population) | 19.1% | 12.0% |
Similar Demographics by Married-couple Households
Demographics Similar to Spanish by Married-couple Households
In terms of married-couple households, the demographic groups most similar to Spanish are Costa Rican (47.2%, a difference of 0.0%), Immigrants from Sweden (47.2%, a difference of 0.020%), Spaniard (47.2%, a difference of 0.020%), Immigrants from Afghanistan (47.2%, a difference of 0.050%), and Immigrants from Belarus (47.2%, a difference of 0.050%).
| Demographics | Rating | Rank | Married-couple Households |
| South Africans | 86.4 /100 | #133 | Excellent 47.3% |
| Immigrants | Greece | 86.0 /100 | #134 | Excellent 47.2% |
| Immigrants | Argentina | 86.0 /100 | #135 | Excellent 47.2% |
| New Zealanders | 85.3 /100 | #136 | Excellent 47.2% |
| Immigrants | Malaysia | 85.2 /100 | #137 | Excellent 47.2% |
| Immigrants | Afghanistan | 85.1 /100 | #138 | Excellent 47.2% |
| Immigrants | Sweden | 84.7 /100 | #139 | Excellent 47.2% |
| Spanish | 84.5 /100 | #140 | Excellent 47.2% |
| Costa Ricans | 84.4 /100 | #141 | Excellent 47.2% |
| Spaniards | 84.1 /100 | #142 | Excellent 47.2% |
| Immigrants | Belarus | 83.8 /100 | #143 | Excellent 47.2% |
| Mexicans | 83.4 /100 | #144 | Excellent 47.1% |
| Slovenes | 81.7 /100 | #145 | Excellent 47.1% |
| Immigrants | Western Europe | 81.6 /100 | #146 | Excellent 47.1% |
| Immigrants | Syria | 81.6 /100 | #147 | Excellent 47.1% |
Demographics Similar to Mongolians by Married-couple Households
In terms of married-couple households, the demographic groups most similar to Mongolians are Malaysian (46.3%, a difference of 0.010%), Immigrants from Zimbabwe (46.3%, a difference of 0.040%), Immigrants from Costa Rica (46.3%, a difference of 0.050%), Immigrants (46.3%, a difference of 0.070%), and Cajun (46.4%, a difference of 0.12%).
| Demographics | Rating | Rank | Married-couple Households |
| Immigrants | Norway | 52.0 /100 | #173 | Average 46.5% |
| Immigrants | Mexico | 50.0 /100 | #174 | Average 46.4% |
| Immigrants | Colombia | 46.1 /100 | #175 | Average 46.4% |
| Cajuns | 45.2 /100 | #176 | Average 46.4% |
| Immigrants | Immigrants | 43.8 /100 | #177 | Average 46.3% |
| Immigrants | Costa Rica | 43.4 /100 | #178 | Average 46.3% |
| Immigrants | Zimbabwe | 43.0 /100 | #179 | Average 46.3% |
| Mongolians | 42.0 /100 | #180 | Average 46.3% |
| Malaysians | 41.8 /100 | #181 | Average 46.3% |
| Yugoslavians | 38.9 /100 | #182 | Fair 46.2% |
| Immigrants | Brazil | 38.3 /100 | #183 | Fair 46.2% |
| Immigrants | Switzerland | 36.9 /100 | #184 | Fair 46.2% |
| Brazilians | 35.9 /100 | #185 | Fair 46.2% |
| Albanians | 31.1 /100 | #186 | Fair 46.1% |
| Fijians | 29.2 /100 | #187 | Fair 46.1% |