Slovak vs Alsatian Married-couple Households
COMPARE
Slovak
Alsatian
Married-couple Households
Married-couple Households Comparison
Slovaks
Alsatians
47.6%
MARRIED-COUPLE HOUSEHOLDS
92.9/ 100
METRIC RATING
115th/ 347
METRIC RANK
44.8%
MARRIED-COUPLE HOUSEHOLDS
2.3/ 100
METRIC RATING
226th/ 347
METRIC RANK
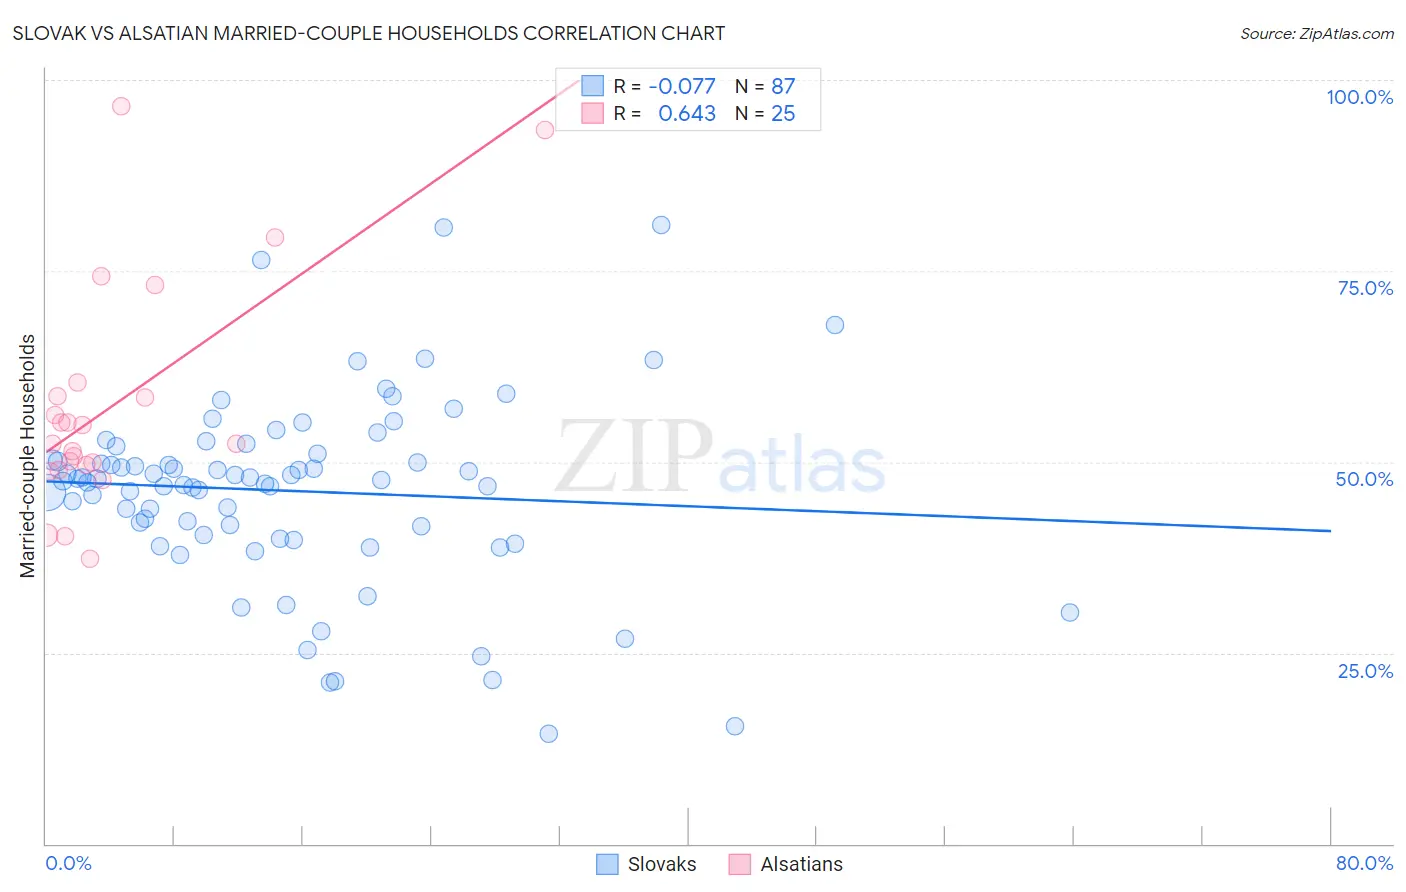
Slovak vs Alsatian Married-couple Households Correlation Chart
The statistical analysis conducted on geographies consisting of 397,658,026 people shows a slight negative correlation between the proportion of Slovaks and percentage of married-couple family households in the United States with a correlation coefficient (R) of -0.077 and weighted average of 47.6%. Similarly, the statistical analysis conducted on geographies consisting of 82,680,020 people shows a significant positive correlation between the proportion of Alsatians and percentage of married-couple family households in the United States with a correlation coefficient (R) of 0.643 and weighted average of 44.8%, a difference of 6.1%.
Married-couple Households Correlation Summary
| Measurement | Slovak | Alsatian |
| Minimum | 14.5% | 37.3% |
| Maximum | 81.0% | 96.6% |
| Range | 66.6% | 59.3% |
| Mean | 46.2% | 57.4% |
| Median | 47.7% | 52.4% |
| Interquartile 25% (IQ1) | 40.4% | 49.3% |
| Interquartile 75% (IQ3) | 51.1% | 59.5% |
| Interquartile Range (IQR) | 10.7% | 10.2% |
| Standard Deviation (Sample) | 12.3% | 15.0% |
| Standard Deviation (Population) | 12.3% | 14.7% |
Similar Demographics by Married-couple Households
Demographics Similar to Slovaks by Married-couple Households
In terms of married-couple households, the demographic groups most similar to Slovaks are Argentinean (47.5%, a difference of 0.050%), French Canadian (47.5%, a difference of 0.060%), Immigrants from Germany (47.5%, a difference of 0.070%), Chilean (47.5%, a difference of 0.10%), and Immigrants from Europe (47.6%, a difference of 0.12%).
| Demographics | Rating | Rank | Married-couple Households |
| Immigrants | Japan | 94.4 /100 | #108 | Exceptional 47.7% |
| Immigrants | Jordan | 94.1 /100 | #109 | Exceptional 47.7% |
| Macedonians | 93.9 /100 | #110 | Exceptional 47.6% |
| Syrians | 93.9 /100 | #111 | Exceptional 47.6% |
| Peruvians | 93.8 /100 | #112 | Exceptional 47.6% |
| Venezuelans | 93.8 /100 | #113 | Exceptional 47.6% |
| Immigrants | Europe | 93.7 /100 | #114 | Exceptional 47.6% |
| Slovaks | 92.9 /100 | #115 | Exceptional 47.6% |
| Argentineans | 92.5 /100 | #116 | Exceptional 47.5% |
| French Canadians | 92.4 /100 | #117 | Exceptional 47.5% |
| Immigrants | Germany | 92.4 /100 | #118 | Exceptional 47.5% |
| Chileans | 92.2 /100 | #119 | Exceptional 47.5% |
| Puget Sound Salish | 90.5 /100 | #120 | Exceptional 47.4% |
| Immigrants | Eastern Europe | 90.3 /100 | #121 | Exceptional 47.4% |
| Okinawans | 90.1 /100 | #122 | Exceptional 47.4% |
Demographics Similar to Alsatians by Married-couple Households
In terms of married-couple households, the demographic groups most similar to Alsatians are Dutch West Indian (44.9%, a difference of 0.10%), Immigrants from Micronesia (44.9%, a difference of 0.12%), Immigrants from Cambodia (44.9%, a difference of 0.14%), Salvadoran (44.7%, a difference of 0.19%), and Kenyan (44.7%, a difference of 0.32%).
| Demographics | Rating | Rank | Married-couple Households |
| Nicaraguans | 5.3 /100 | #219 | Tragic 45.2% |
| Immigrants | Thailand | 5.1 /100 | #220 | Tragic 45.2% |
| Tlingit-Haida | 4.9 /100 | #221 | Tragic 45.1% |
| Immigrants | Laos | 4.6 /100 | #222 | Tragic 45.1% |
| Immigrants | Cambodia | 2.7 /100 | #223 | Tragic 44.9% |
| Immigrants | Micronesia | 2.6 /100 | #224 | Tragic 44.9% |
| Dutch West Indians | 2.6 /100 | #225 | Tragic 44.9% |
| Alsatians | 2.3 /100 | #226 | Tragic 44.8% |
| Salvadorans | 1.9 /100 | #227 | Tragic 44.7% |
| Kenyans | 1.7 /100 | #228 | Tragic 44.7% |
| Immigrants | Latin America | 1.6 /100 | #229 | Tragic 44.7% |
| Soviet Union | 1.6 /100 | #230 | Tragic 44.6% |
| Houma | 1.5 /100 | #231 | Tragic 44.6% |
| Marshallese | 1.5 /100 | #232 | Tragic 44.6% |
| Immigrants | Uganda | 1.5 /100 | #233 | Tragic 44.6% |