Seminole vs Inupiat Married-couple Households
COMPARE
Seminole
Inupiat
Married-couple Households
Married-couple Households Comparison
Seminole
Inupiat
44.0%
MARRIED-COUPLE HOUSEHOLDS
0.4/ 100
METRIC RATING
252nd/ 347
METRIC RANK
42.4%
MARRIED-COUPLE HOUSEHOLDS
0.0/ 100
METRIC RATING
283rd/ 347
METRIC RANK
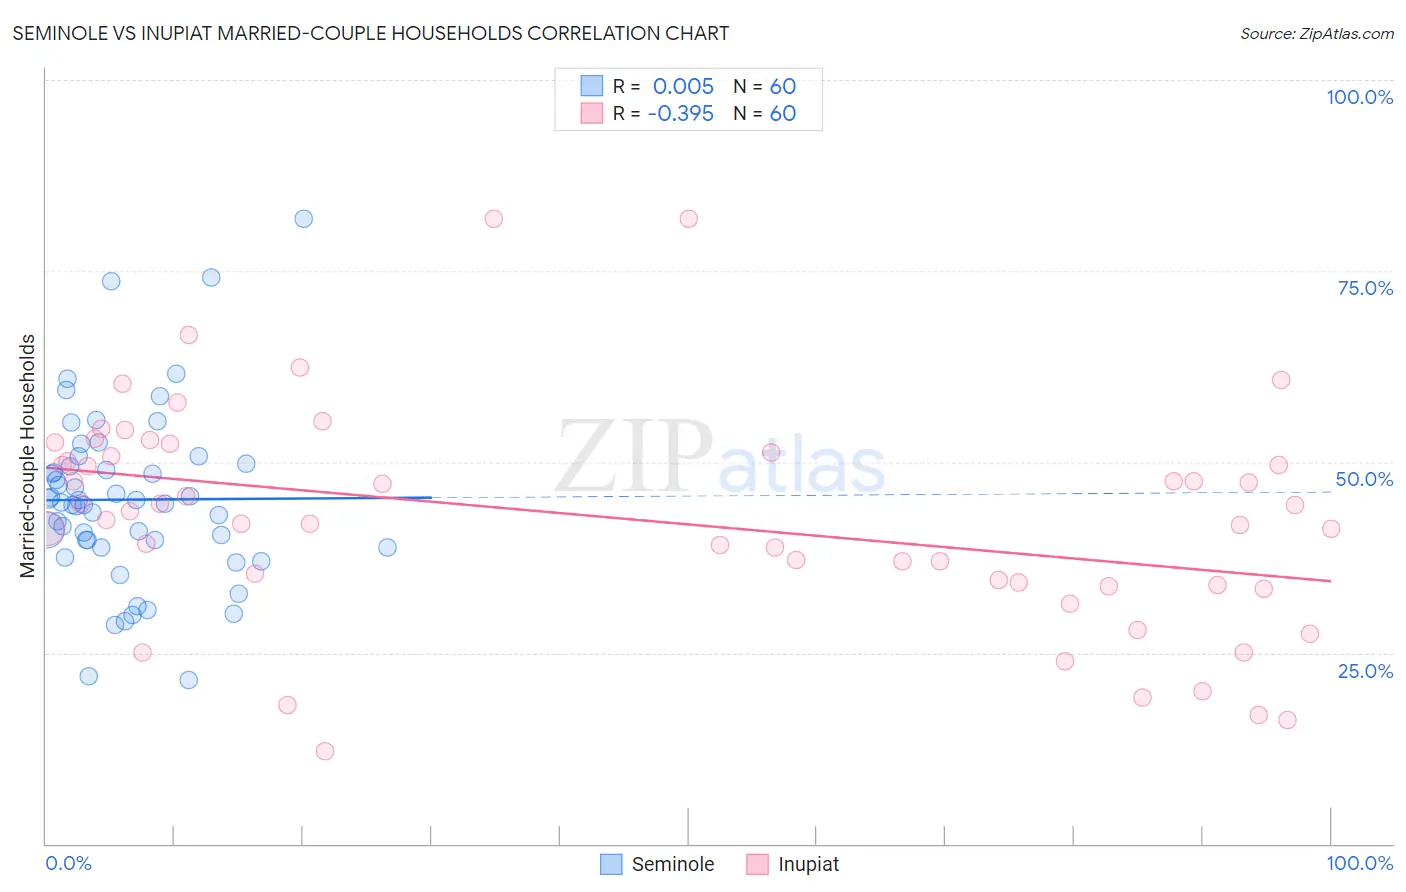
Seminole vs Inupiat Married-couple Households Correlation Chart
The statistical analysis conducted on geographies consisting of 118,298,576 people shows no correlation between the proportion of Seminole and percentage of married-couple family households in the United States with a correlation coefficient (R) of 0.005 and weighted average of 44.0%. Similarly, the statistical analysis conducted on geographies consisting of 96,320,700 people shows a mild negative correlation between the proportion of Inupiat and percentage of married-couple family households in the United States with a correlation coefficient (R) of -0.395 and weighted average of 42.4%, a difference of 3.7%.
Married-couple Households Correlation Summary
| Measurement | Seminole | Inupiat |
| Minimum | 21.4% | 12.1% |
| Maximum | 81.8% | 81.8% |
| Range | 60.4% | 69.7% |
| Mean | 45.1% | 42.6% |
| Median | 44.6% | 43.0% |
| Interquartile 25% (IQ1) | 39.2% | 34.1% |
| Interquartile 75% (IQ3) | 49.6% | 51.0% |
| Interquartile Range (IQR) | 10.3% | 16.9% |
| Standard Deviation (Sample) | 11.4% | 14.4% |
| Standard Deviation (Population) | 11.3% | 14.3% |
Similar Demographics by Married-couple Households
Demographics Similar to Seminole by Married-couple Households
In terms of married-couple households, the demographic groups most similar to Seminole are German Russian (44.0%, a difference of 0.070%), Central American (43.9%, a difference of 0.12%), French American Indian (44.1%, a difference of 0.15%), Immigrants from Kenya (44.1%, a difference of 0.16%), and Apache (43.9%, a difference of 0.17%).
| Demographics | Rating | Rank | Married-couple Households |
| Immigrants | El Salvador | 0.7 /100 | #245 | Tragic 44.3% |
| Immigrants | Cuba | 0.6 /100 | #246 | Tragic 44.2% |
| Immigrants | Morocco | 0.6 /100 | #247 | Tragic 44.2% |
| Yup'ik | 0.4 /100 | #248 | Tragic 44.1% |
| Immigrants | Kenya | 0.4 /100 | #249 | Tragic 44.1% |
| French American Indians | 0.4 /100 | #250 | Tragic 44.1% |
| German Russians | 0.4 /100 | #251 | Tragic 44.0% |
| Seminole | 0.4 /100 | #252 | Tragic 44.0% |
| Central Americans | 0.3 /100 | #253 | Tragic 43.9% |
| Apache | 0.3 /100 | #254 | Tragic 43.9% |
| Shoshone | 0.3 /100 | #255 | Tragic 43.9% |
| Ugandans | 0.3 /100 | #256 | Tragic 43.8% |
| Blackfeet | 0.2 /100 | #257 | Tragic 43.8% |
| Central American Indians | 0.2 /100 | #258 | Tragic 43.8% |
| Iroquois | 0.2 /100 | #259 | Tragic 43.7% |
Demographics Similar to Inupiat by Married-couple Households
In terms of married-couple households, the demographic groups most similar to Inupiat are Bermudan (42.4%, a difference of 0.10%), Cheyenne (42.3%, a difference of 0.36%), Ghanaian (42.2%, a difference of 0.39%), Belizean (42.2%, a difference of 0.39%), and Chippewa (42.1%, a difference of 0.63%).
| Demographics | Rating | Rank | Married-couple Households |
| Immigrants | Ethiopia | 0.0 /100 | #276 | Tragic 43.1% |
| Immigrants | Eastern Africa | 0.0 /100 | #277 | Tragic 42.9% |
| Immigrants | Africa | 0.0 /100 | #278 | Tragic 42.9% |
| Sierra Leoneans | 0.0 /100 | #279 | Tragic 42.9% |
| Immigrants | Ecuador | 0.0 /100 | #280 | Tragic 42.9% |
| Immigrants | Guatemala | 0.0 /100 | #281 | Tragic 42.8% |
| Bermudans | 0.0 /100 | #282 | Tragic 42.4% |
| Inupiat | 0.0 /100 | #283 | Tragic 42.4% |
| Cheyenne | 0.0 /100 | #284 | Tragic 42.3% |
| Ghanaians | 0.0 /100 | #285 | Tragic 42.2% |
| Belizeans | 0.0 /100 | #286 | Tragic 42.2% |
| Chippewa | 0.0 /100 | #287 | Tragic 42.1% |
| Immigrants | Eritrea | 0.0 /100 | #288 | Tragic 42.1% |
| Sudanese | 0.0 /100 | #289 | Tragic 42.1% |
| Hondurans | 0.0 /100 | #290 | Tragic 42.1% |