Moroccan vs Inupiat Married-couple Households
COMPARE
Moroccan
Inupiat
Married-couple Households
Married-couple Households Comparison
Moroccans
Inupiat
43.5%
MARRIED-COUPLE HOUSEHOLDS
0.1/ 100
METRIC RATING
265th/ 347
METRIC RANK
42.4%
MARRIED-COUPLE HOUSEHOLDS
0.0/ 100
METRIC RATING
283rd/ 347
METRIC RANK
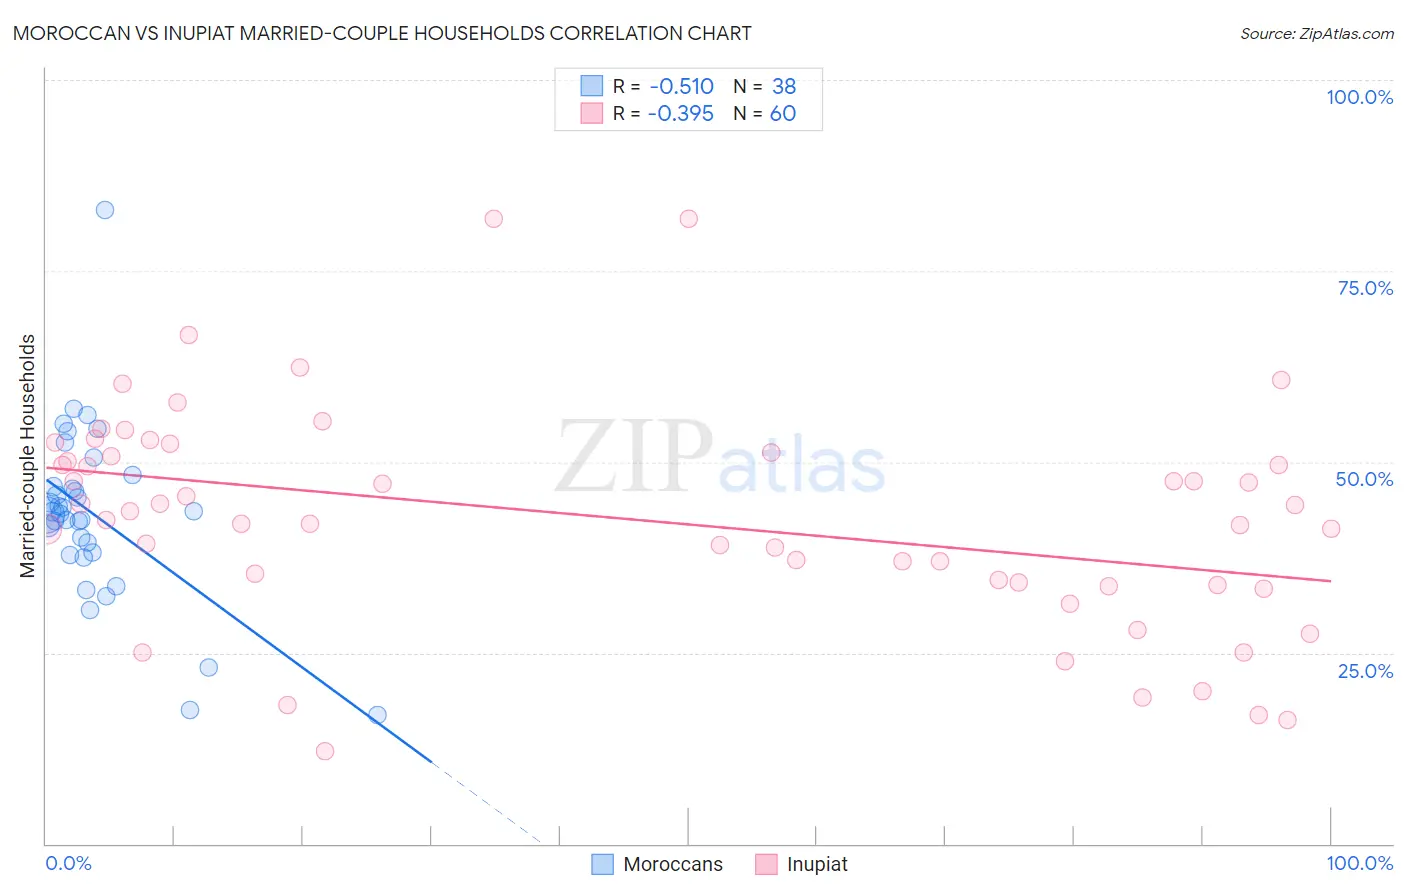
Moroccan vs Inupiat Married-couple Households Correlation Chart
The statistical analysis conducted on geographies consisting of 201,755,880 people shows a substantial negative correlation between the proportion of Moroccans and percentage of married-couple family households in the United States with a correlation coefficient (R) of -0.510 and weighted average of 43.5%. Similarly, the statistical analysis conducted on geographies consisting of 96,320,700 people shows a mild negative correlation between the proportion of Inupiat and percentage of married-couple family households in the United States with a correlation coefficient (R) of -0.395 and weighted average of 42.4%, a difference of 2.6%.
Married-couple Households Correlation Summary
| Measurement | Moroccan | Inupiat |
| Minimum | 16.8% | 12.1% |
| Maximum | 83.0% | 81.8% |
| Range | 66.2% | 69.7% |
| Mean | 43.1% | 42.6% |
| Median | 43.3% | 43.0% |
| Interquartile 25% (IQ1) | 38.2% | 34.1% |
| Interquartile 75% (IQ3) | 46.7% | 51.0% |
| Interquartile Range (IQR) | 8.5% | 16.9% |
| Standard Deviation (Sample) | 11.5% | 14.4% |
| Standard Deviation (Population) | 11.3% | 14.3% |
Demographics Similar to Moroccans and Inupiat by Married-couple Households
In terms of married-couple households, the demographic groups most similar to Moroccans are Ecuadorian (43.5%, a difference of 0.040%), Bangladeshi (43.5%, a difference of 0.080%), Native/Alaskan (43.5%, a difference of 0.090%), Immigrants from Burma/Myanmar (43.4%, a difference of 0.20%), and Immigrants from Sierra Leone (43.3%, a difference of 0.40%). Similarly, the demographic groups most similar to Inupiat are Bermudan (42.4%, a difference of 0.10%), Cheyenne (42.3%, a difference of 0.36%), Immigrants from Guatemala (42.8%, a difference of 1.0%), Immigrants from Ecuador (42.9%, a difference of 1.1%), and Sierra Leonean (42.9%, a difference of 1.1%).
| Demographics | Rating | Rank | Married-couple Households |
| Bangladeshis | 0.1 /100 | #264 | Tragic 43.5% |
| Moroccans | 0.1 /100 | #265 | Tragic 43.5% |
| Ecuadorians | 0.1 /100 | #266 | Tragic 43.5% |
| Natives/Alaskans | 0.1 /100 | #267 | Tragic 43.5% |
| Immigrants | Burma/Myanmar | 0.1 /100 | #268 | Tragic 43.4% |
| Immigrants | Sierra Leone | 0.1 /100 | #269 | Tragic 43.3% |
| Yuman | 0.1 /100 | #270 | Tragic 43.3% |
| Guatemalans | 0.1 /100 | #271 | Tragic 43.3% |
| Immigrants | Nigeria | 0.1 /100 | #272 | Tragic 43.2% |
| Ethiopians | 0.1 /100 | #273 | Tragic 43.2% |
| Nigerians | 0.1 /100 | #274 | Tragic 43.2% |
| Immigrants | Bangladesh | 0.0 /100 | #275 | Tragic 43.1% |
| Immigrants | Ethiopia | 0.0 /100 | #276 | Tragic 43.1% |
| Immigrants | Eastern Africa | 0.0 /100 | #277 | Tragic 42.9% |
| Immigrants | Africa | 0.0 /100 | #278 | Tragic 42.9% |
| Sierra Leoneans | 0.0 /100 | #279 | Tragic 42.9% |
| Immigrants | Ecuador | 0.0 /100 | #280 | Tragic 42.9% |
| Immigrants | Guatemala | 0.0 /100 | #281 | Tragic 42.8% |
| Bermudans | 0.0 /100 | #282 | Tragic 42.4% |
| Inupiat | 0.0 /100 | #283 | Tragic 42.4% |
| Cheyenne | 0.0 /100 | #284 | Tragic 42.3% |