Seminole vs Burmese Married-couple Households
COMPARE
Seminole
Burmese
Married-couple Households
Married-couple Households Comparison
Seminole
Burmese
44.0%
MARRIED-COUPLE HOUSEHOLDS
0.4/ 100
METRIC RATING
252nd/ 347
METRIC RANK
49.8%
MARRIED-COUPLE HOUSEHOLDS
100.0/ 100
METRIC RATING
14th/ 347
METRIC RANK
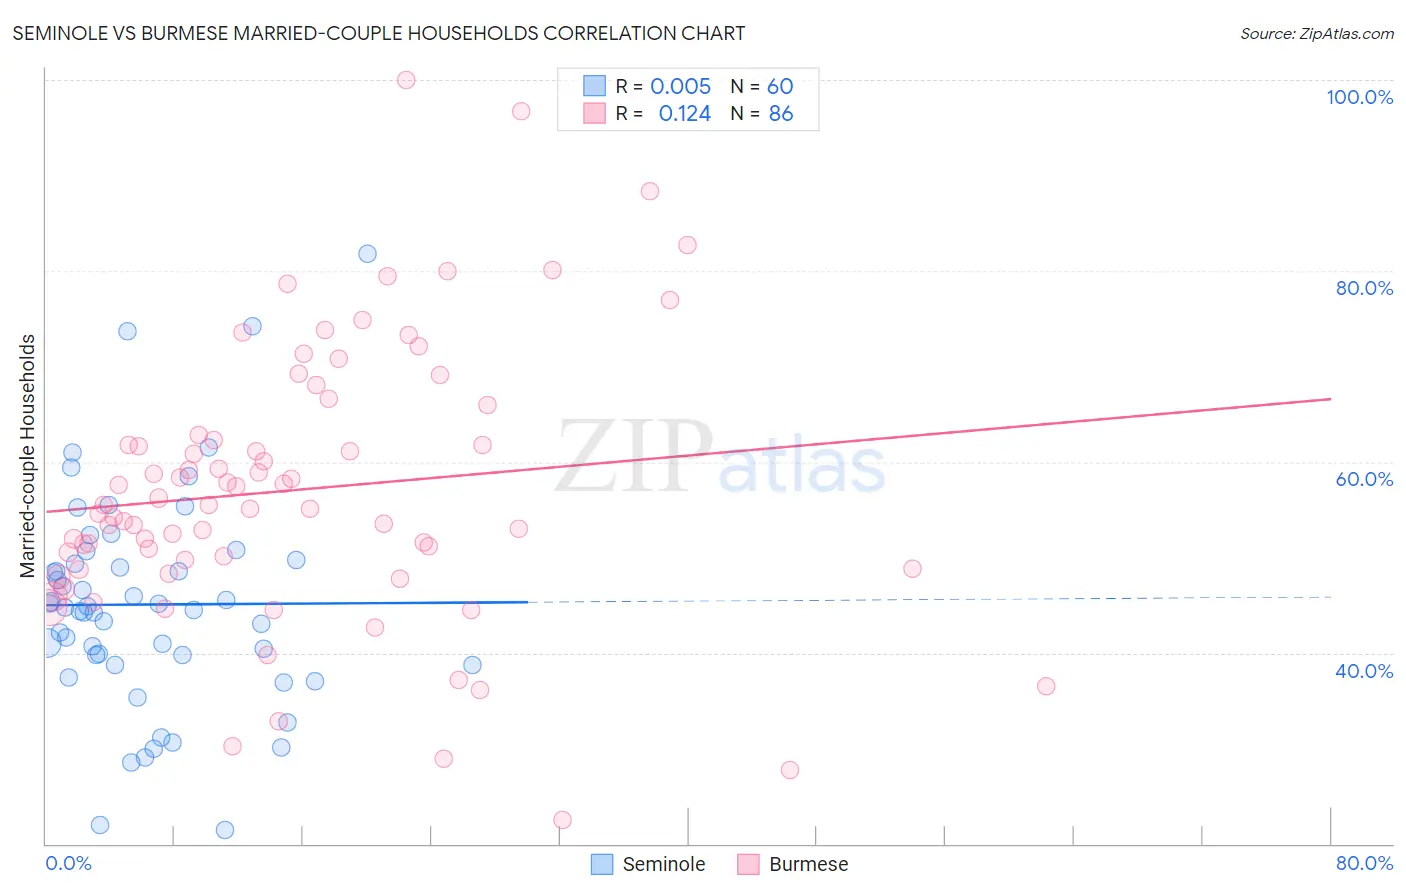
Seminole vs Burmese Married-couple Households Correlation Chart
The statistical analysis conducted on geographies consisting of 118,298,576 people shows no correlation between the proportion of Seminole and percentage of married-couple family households in the United States with a correlation coefficient (R) of 0.005 and weighted average of 44.0%. Similarly, the statistical analysis conducted on geographies consisting of 464,866,079 people shows a poor positive correlation between the proportion of Burmese and percentage of married-couple family households in the United States with a correlation coefficient (R) of 0.124 and weighted average of 49.8%, a difference of 13.2%.
Married-couple Households Correlation Summary
| Measurement | Seminole | Burmese |
| Minimum | 21.4% | 22.5% |
| Maximum | 81.8% | 100.0% |
| Range | 60.4% | 77.5% |
| Mean | 45.1% | 57.1% |
| Median | 44.6% | 55.3% |
| Interquartile 25% (IQ1) | 39.2% | 48.7% |
| Interquartile 75% (IQ3) | 49.6% | 62.8% |
| Interquartile Range (IQR) | 10.3% | 14.0% |
| Standard Deviation (Sample) | 11.4% | 14.5% |
| Standard Deviation (Population) | 11.3% | 14.4% |
Similar Demographics by Married-couple Households
Demographics Similar to Seminole by Married-couple Households
In terms of married-couple households, the demographic groups most similar to Seminole are German Russian (44.0%, a difference of 0.070%), Central American (43.9%, a difference of 0.12%), French American Indian (44.1%, a difference of 0.15%), Immigrants from Kenya (44.1%, a difference of 0.16%), and Apache (43.9%, a difference of 0.17%).
| Demographics | Rating | Rank | Married-couple Households |
| Immigrants | El Salvador | 0.7 /100 | #245 | Tragic 44.3% |
| Immigrants | Cuba | 0.6 /100 | #246 | Tragic 44.2% |
| Immigrants | Morocco | 0.6 /100 | #247 | Tragic 44.2% |
| Yup'ik | 0.4 /100 | #248 | Tragic 44.1% |
| Immigrants | Kenya | 0.4 /100 | #249 | Tragic 44.1% |
| French American Indians | 0.4 /100 | #250 | Tragic 44.1% |
| German Russians | 0.4 /100 | #251 | Tragic 44.0% |
| Seminole | 0.4 /100 | #252 | Tragic 44.0% |
| Central Americans | 0.3 /100 | #253 | Tragic 43.9% |
| Apache | 0.3 /100 | #254 | Tragic 43.9% |
| Shoshone | 0.3 /100 | #255 | Tragic 43.9% |
| Ugandans | 0.3 /100 | #256 | Tragic 43.8% |
| Blackfeet | 0.2 /100 | #257 | Tragic 43.8% |
| Central American Indians | 0.2 /100 | #258 | Tragic 43.8% |
| Iroquois | 0.2 /100 | #259 | Tragic 43.7% |
Demographics Similar to Burmese by Married-couple Households
In terms of married-couple households, the demographic groups most similar to Burmese are Immigrants from Korea (49.9%, a difference of 0.13%), Korean (49.7%, a difference of 0.14%), Swedish (49.7%, a difference of 0.18%), Swiss (49.9%, a difference of 0.30%), and Immigrants from Hong Kong (49.6%, a difference of 0.33%).
| Demographics | Rating | Rank | Married-couple Households |
| Filipinos | 100.0 /100 | #7 | Exceptional 51.0% |
| Immigrants | South Central Asia | 100.0 /100 | #8 | Exceptional 50.6% |
| Pennsylvania Germans | 100.0 /100 | #9 | Exceptional 50.4% |
| Chinese | 100.0 /100 | #10 | Exceptional 50.4% |
| Immigrants | Pakistan | 100.0 /100 | #11 | Exceptional 50.1% |
| Swiss | 100.0 /100 | #12 | Exceptional 49.9% |
| Immigrants | Korea | 100.0 /100 | #13 | Exceptional 49.9% |
| Burmese | 100.0 /100 | #14 | Exceptional 49.8% |
| Koreans | 99.9 /100 | #15 | Exceptional 49.7% |
| Swedes | 99.9 /100 | #16 | Exceptional 49.7% |
| Immigrants | Hong Kong | 99.9 /100 | #17 | Exceptional 49.6% |
| English | 99.9 /100 | #18 | Exceptional 49.6% |
| Europeans | 99.9 /100 | #19 | Exceptional 49.6% |
| Scandinavians | 99.9 /100 | #20 | Exceptional 49.6% |
| Norwegians | 99.9 /100 | #21 | Exceptional 49.5% |