Navajo vs Inupiat Married-couple Households
COMPARE
Navajo
Inupiat
Married-couple Households
Married-couple Households Comparison
Navajo
Inupiat
40.1%
MARRIED-COUPLE HOUSEHOLDS
0.0/ 100
METRIC RATING
324th/ 347
METRIC RANK
42.4%
MARRIED-COUPLE HOUSEHOLDS
0.0/ 100
METRIC RATING
283rd/ 347
METRIC RANK
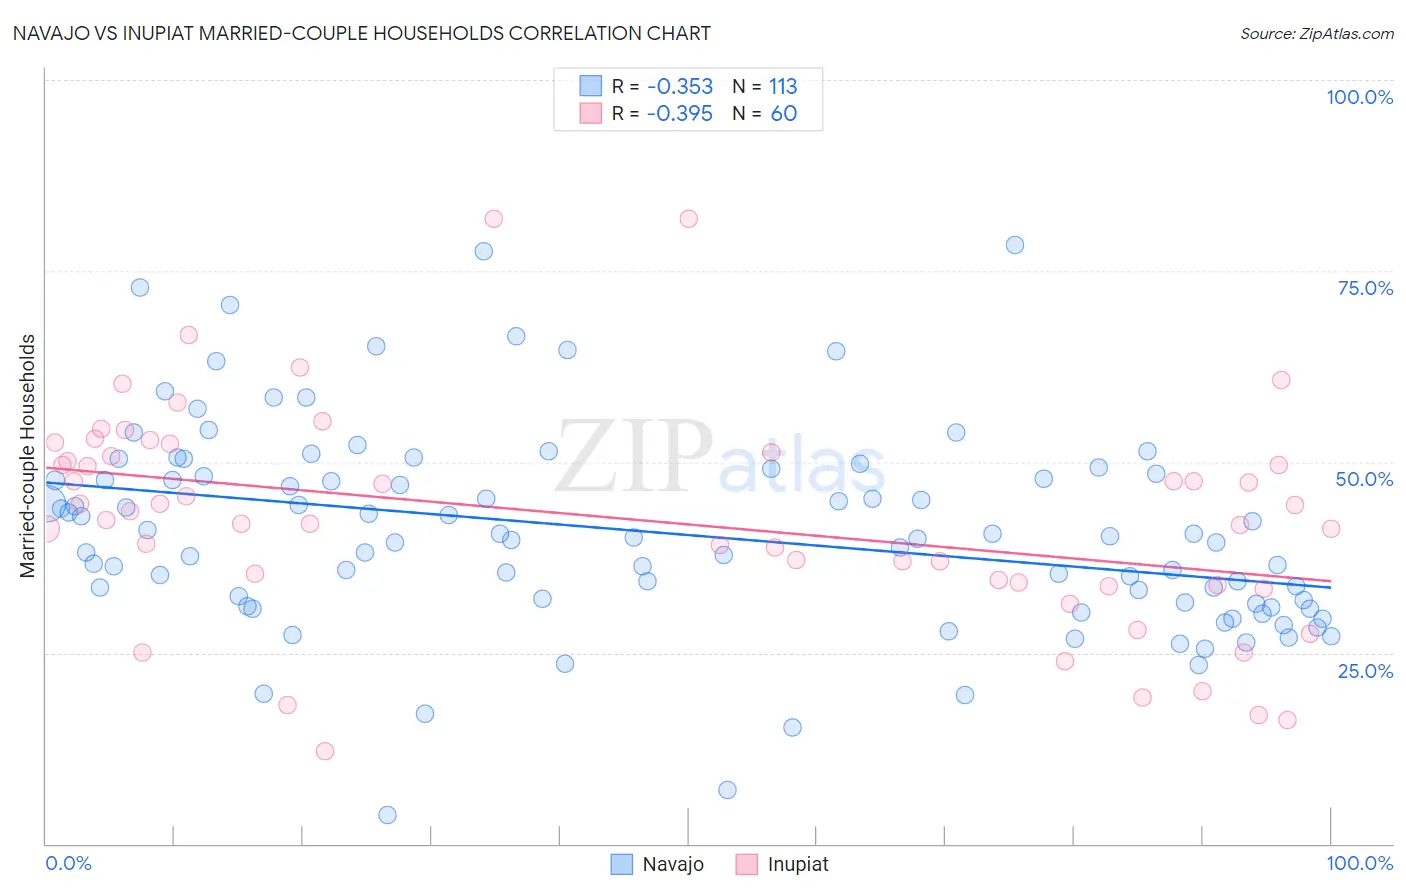
Navajo vs Inupiat Married-couple Households Correlation Chart
The statistical analysis conducted on geographies consisting of 224,747,945 people shows a mild negative correlation between the proportion of Navajo and percentage of married-couple family households in the United States with a correlation coefficient (R) of -0.353 and weighted average of 40.1%. Similarly, the statistical analysis conducted on geographies consisting of 96,320,700 people shows a mild negative correlation between the proportion of Inupiat and percentage of married-couple family households in the United States with a correlation coefficient (R) of -0.395 and weighted average of 42.4%, a difference of 5.9%.
Married-couple Households Correlation Summary
| Measurement | Navajo | Inupiat |
| Minimum | 3.8% | 12.1% |
| Maximum | 78.4% | 81.8% |
| Range | 74.6% | 69.7% |
| Mean | 40.7% | 42.6% |
| Median | 39.9% | 43.0% |
| Interquartile 25% (IQ1) | 31.5% | 34.1% |
| Interquartile 75% (IQ3) | 48.3% | 51.0% |
| Interquartile Range (IQR) | 16.8% | 16.9% |
| Standard Deviation (Sample) | 13.4% | 14.4% |
| Standard Deviation (Population) | 13.3% | 14.3% |
Similar Demographics by Married-couple Households
Demographics Similar to Navajo by Married-couple Households
In terms of married-couple households, the demographic groups most similar to Navajo are Immigrants from Zaire (40.1%, a difference of 0.010%), Puerto Rican (40.1%, a difference of 0.010%), Pueblo (40.0%, a difference of 0.23%), Immigrants from Liberia (40.3%, a difference of 0.67%), and U.S. Virgin Islander (39.8%, a difference of 0.69%).
| Demographics | Rating | Rank | Married-couple Households |
| Immigrants | Jamaica | 0.0 /100 | #317 | Tragic 40.7% |
| Liberians | 0.0 /100 | #318 | Tragic 40.7% |
| Bahamians | 0.0 /100 | #319 | Tragic 40.5% |
| West Indians | 0.0 /100 | #320 | Tragic 40.3% |
| Immigrants | Liberia | 0.0 /100 | #321 | Tragic 40.3% |
| Immigrants | Zaire | 0.0 /100 | #322 | Tragic 40.1% |
| Puerto Ricans | 0.0 /100 | #323 | Tragic 40.1% |
| Navajo | 0.0 /100 | #324 | Tragic 40.1% |
| Pueblo | 0.0 /100 | #325 | Tragic 40.0% |
| U.S. Virgin Islanders | 0.0 /100 | #326 | Tragic 39.8% |
| Lumbee | 0.0 /100 | #327 | Tragic 39.6% |
| Barbadians | 0.0 /100 | #328 | Tragic 39.4% |
| Immigrants | Dominica | 0.0 /100 | #329 | Tragic 39.4% |
| Immigrants | Barbados | 0.0 /100 | #330 | Tragic 39.2% |
| Immigrants | Congo | 0.0 /100 | #331 | Tragic 39.0% |
Demographics Similar to Inupiat by Married-couple Households
In terms of married-couple households, the demographic groups most similar to Inupiat are Bermudan (42.4%, a difference of 0.10%), Cheyenne (42.3%, a difference of 0.36%), Ghanaian (42.2%, a difference of 0.39%), Belizean (42.2%, a difference of 0.39%), and Chippewa (42.1%, a difference of 0.63%).
| Demographics | Rating | Rank | Married-couple Households |
| Immigrants | Ethiopia | 0.0 /100 | #276 | Tragic 43.1% |
| Immigrants | Eastern Africa | 0.0 /100 | #277 | Tragic 42.9% |
| Immigrants | Africa | 0.0 /100 | #278 | Tragic 42.9% |
| Sierra Leoneans | 0.0 /100 | #279 | Tragic 42.9% |
| Immigrants | Ecuador | 0.0 /100 | #280 | Tragic 42.9% |
| Immigrants | Guatemala | 0.0 /100 | #281 | Tragic 42.8% |
| Bermudans | 0.0 /100 | #282 | Tragic 42.4% |
| Inupiat | 0.0 /100 | #283 | Tragic 42.4% |
| Cheyenne | 0.0 /100 | #284 | Tragic 42.3% |
| Ghanaians | 0.0 /100 | #285 | Tragic 42.2% |
| Belizeans | 0.0 /100 | #286 | Tragic 42.2% |
| Chippewa | 0.0 /100 | #287 | Tragic 42.1% |
| Immigrants | Eritrea | 0.0 /100 | #288 | Tragic 42.1% |
| Sudanese | 0.0 /100 | #289 | Tragic 42.1% |
| Hondurans | 0.0 /100 | #290 | Tragic 42.1% |