Immigrants from Haiti vs Inupiat Married-couple Households
COMPARE
Immigrants from Haiti
Inupiat
Married-couple Households
Married-couple Households Comparison
Immigrants from Haiti
Inupiat
40.9%
MARRIED-COUPLE HOUSEHOLDS
0.0/ 100
METRIC RATING
313th/ 347
METRIC RANK
42.4%
MARRIED-COUPLE HOUSEHOLDS
0.0/ 100
METRIC RATING
283rd/ 347
METRIC RANK
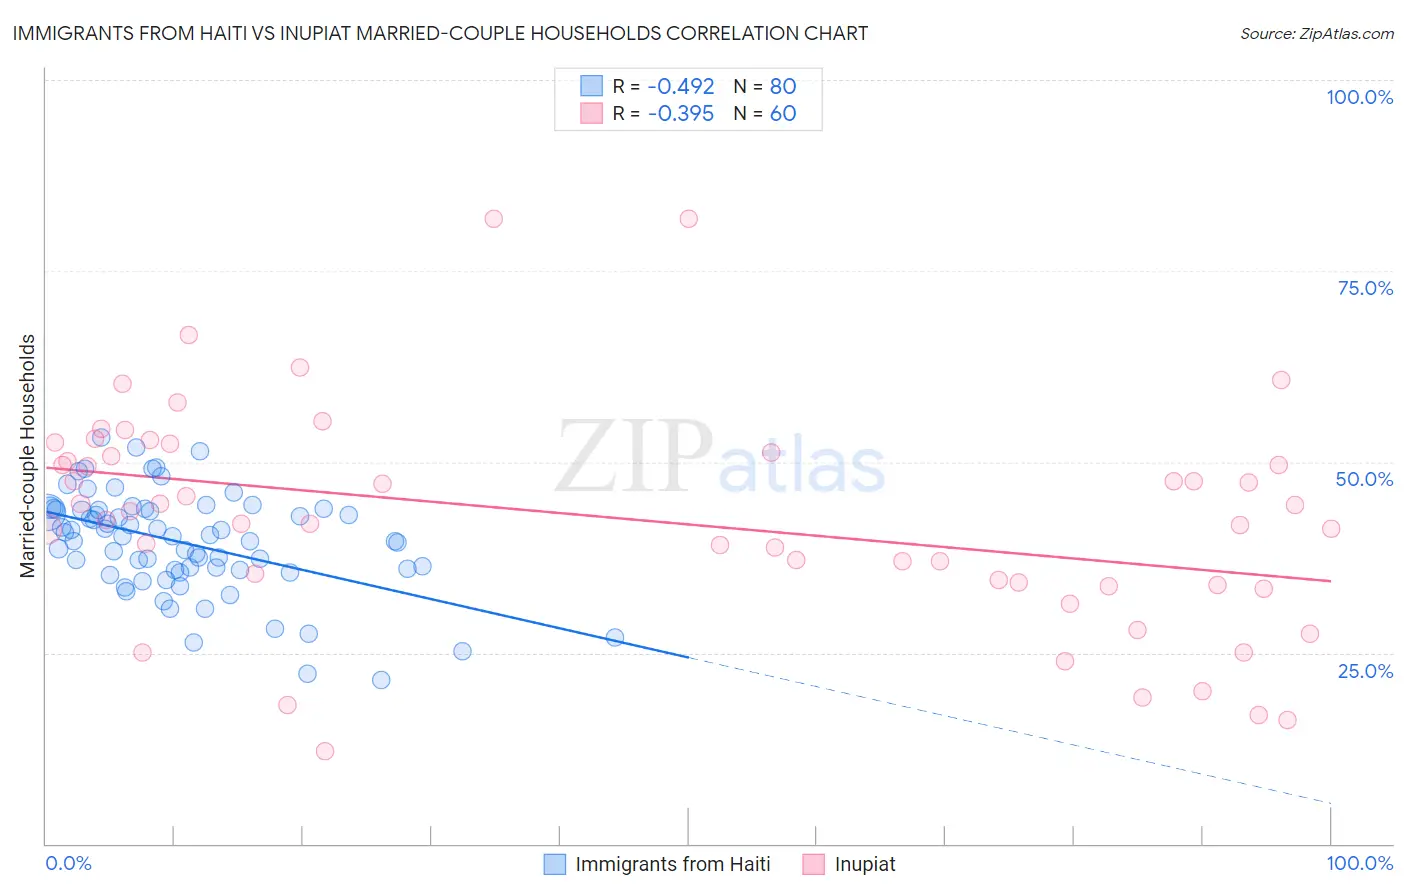
Immigrants from Haiti vs Inupiat Married-couple Households Correlation Chart
The statistical analysis conducted on geographies consisting of 225,169,586 people shows a moderate negative correlation between the proportion of Immigrants from Haiti and percentage of married-couple family households in the United States with a correlation coefficient (R) of -0.492 and weighted average of 40.9%. Similarly, the statistical analysis conducted on geographies consisting of 96,320,700 people shows a mild negative correlation between the proportion of Inupiat and percentage of married-couple family households in the United States with a correlation coefficient (R) of -0.395 and weighted average of 42.4%, a difference of 3.6%.
Married-couple Households Correlation Summary
| Measurement | Immigrants from Haiti | Inupiat |
| Minimum | 21.4% | 12.1% |
| Maximum | 53.2% | 81.8% |
| Range | 31.8% | 69.7% |
| Mean | 39.4% | 42.6% |
| Median | 40.3% | 43.0% |
| Interquartile 25% (IQ1) | 35.8% | 34.1% |
| Interquartile 75% (IQ3) | 43.8% | 51.0% |
| Interquartile Range (IQR) | 7.9% | 16.9% |
| Standard Deviation (Sample) | 6.6% | 14.4% |
| Standard Deviation (Population) | 6.6% | 14.3% |
Similar Demographics by Married-couple Households
Demographics Similar to Immigrants from Haiti by Married-couple Households
In terms of married-couple households, the demographic groups most similar to Immigrants from Haiti are African (40.9%, a difference of 0.060%), Jamaican (40.9%, a difference of 0.080%), Colville (41.0%, a difference of 0.15%), Trinidadian and Tobagonian (40.9%, a difference of 0.15%), and Immigrants from Caribbean (40.8%, a difference of 0.34%).
| Demographics | Rating | Rank | Married-couple Households |
| Guyanese | 0.0 /100 | #306 | Tragic 41.4% |
| Immigrants | Western Africa | 0.0 /100 | #307 | Tragic 41.4% |
| Crow | 0.0 /100 | #308 | Tragic 41.4% |
| Immigrants | Trinidad and Tobago | 0.0 /100 | #309 | Tragic 41.2% |
| Haitians | 0.0 /100 | #310 | Tragic 41.2% |
| Colville | 0.0 /100 | #311 | Tragic 41.0% |
| Africans | 0.0 /100 | #312 | Tragic 40.9% |
| Immigrants | Haiti | 0.0 /100 | #313 | Tragic 40.9% |
| Jamaicans | 0.0 /100 | #314 | Tragic 40.9% |
| Trinidadians and Tobagonians | 0.0 /100 | #315 | Tragic 40.9% |
| Immigrants | Caribbean | 0.0 /100 | #316 | Tragic 40.8% |
| Immigrants | Jamaica | 0.0 /100 | #317 | Tragic 40.7% |
| Liberians | 0.0 /100 | #318 | Tragic 40.7% |
| Bahamians | 0.0 /100 | #319 | Tragic 40.5% |
| West Indians | 0.0 /100 | #320 | Tragic 40.3% |
Demographics Similar to Inupiat by Married-couple Households
In terms of married-couple households, the demographic groups most similar to Inupiat are Bermudan (42.4%, a difference of 0.10%), Cheyenne (42.3%, a difference of 0.36%), Ghanaian (42.2%, a difference of 0.39%), Belizean (42.2%, a difference of 0.39%), and Chippewa (42.1%, a difference of 0.63%).
| Demographics | Rating | Rank | Married-couple Households |
| Immigrants | Ethiopia | 0.0 /100 | #276 | Tragic 43.1% |
| Immigrants | Eastern Africa | 0.0 /100 | #277 | Tragic 42.9% |
| Immigrants | Africa | 0.0 /100 | #278 | Tragic 42.9% |
| Sierra Leoneans | 0.0 /100 | #279 | Tragic 42.9% |
| Immigrants | Ecuador | 0.0 /100 | #280 | Tragic 42.9% |
| Immigrants | Guatemala | 0.0 /100 | #281 | Tragic 42.8% |
| Bermudans | 0.0 /100 | #282 | Tragic 42.4% |
| Inupiat | 0.0 /100 | #283 | Tragic 42.4% |
| Cheyenne | 0.0 /100 | #284 | Tragic 42.3% |
| Ghanaians | 0.0 /100 | #285 | Tragic 42.2% |
| Belizeans | 0.0 /100 | #286 | Tragic 42.2% |
| Chippewa | 0.0 /100 | #287 | Tragic 42.1% |
| Immigrants | Eritrea | 0.0 /100 | #288 | Tragic 42.1% |
| Sudanese | 0.0 /100 | #289 | Tragic 42.1% |
| Hondurans | 0.0 /100 | #290 | Tragic 42.1% |