Seminole vs Dutch West Indian Married-couple Households
COMPARE
Seminole
Dutch West Indian
Married-couple Households
Married-couple Households Comparison
Seminole
Dutch West Indians
44.0%
MARRIED-COUPLE HOUSEHOLDS
0.4/ 100
METRIC RATING
252nd/ 347
METRIC RANK
44.9%
MARRIED-COUPLE HOUSEHOLDS
2.6/ 100
METRIC RATING
225th/ 347
METRIC RANK
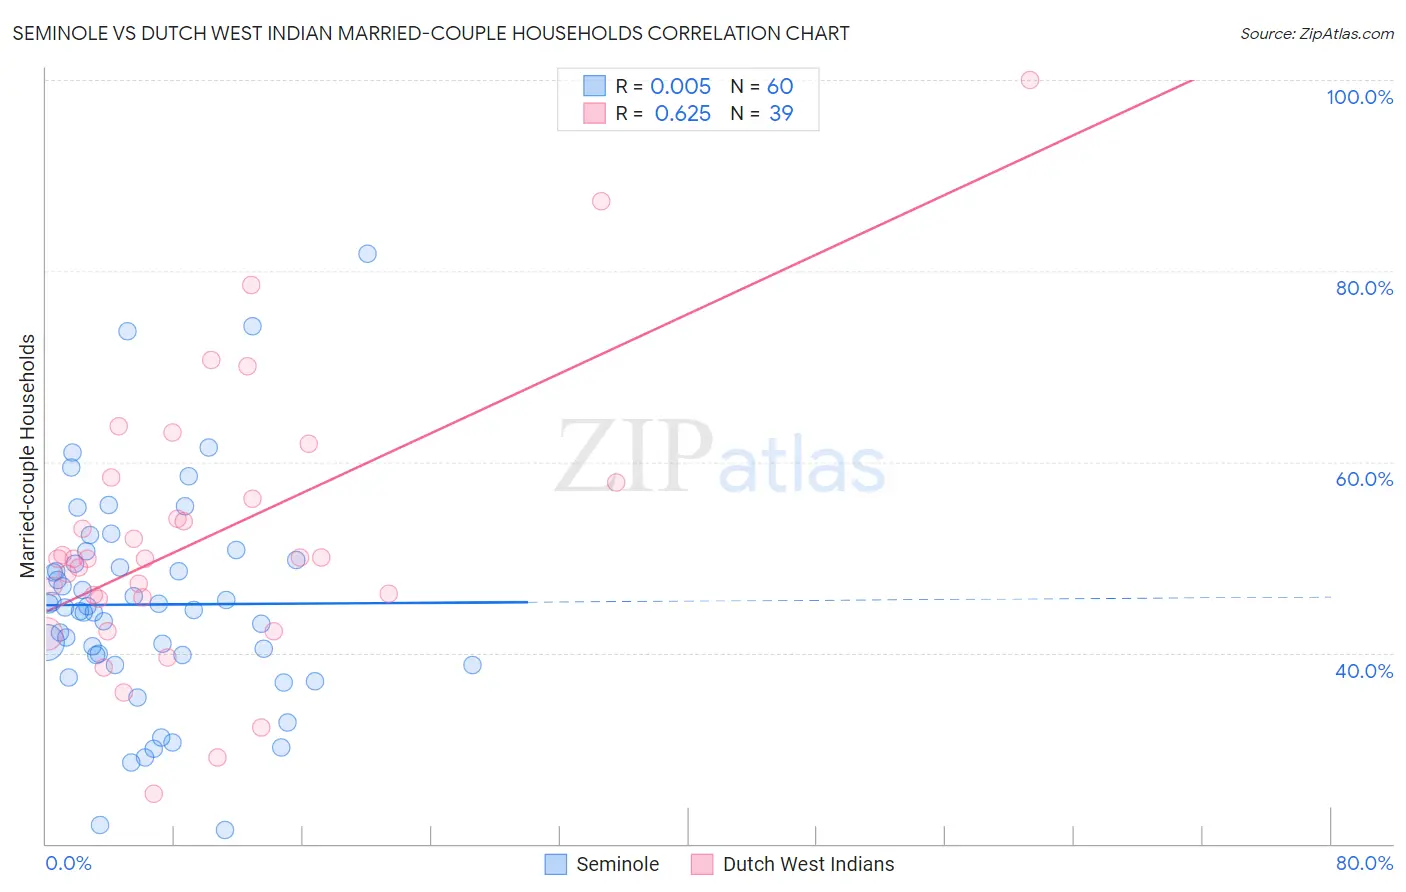
Seminole vs Dutch West Indian Married-couple Households Correlation Chart
The statistical analysis conducted on geographies consisting of 118,298,576 people shows no correlation between the proportion of Seminole and percentage of married-couple family households in the United States with a correlation coefficient (R) of 0.005 and weighted average of 44.0%. Similarly, the statistical analysis conducted on geographies consisting of 85,766,560 people shows a significant positive correlation between the proportion of Dutch West Indians and percentage of married-couple family households in the United States with a correlation coefficient (R) of 0.625 and weighted average of 44.9%, a difference of 2.0%.
Married-couple Households Correlation Summary
| Measurement | Seminole | Dutch West Indian |
| Minimum | 21.4% | 25.3% |
| Maximum | 81.8% | 100.0% |
| Range | 60.4% | 74.7% |
| Mean | 45.1% | 52.1% |
| Median | 44.6% | 49.8% |
| Interquartile 25% (IQ1) | 39.2% | 45.7% |
| Interquartile 75% (IQ3) | 49.6% | 57.9% |
| Interquartile Range (IQR) | 10.3% | 12.2% |
| Standard Deviation (Sample) | 11.4% | 14.6% |
| Standard Deviation (Population) | 11.3% | 14.5% |
Similar Demographics by Married-couple Households
Demographics Similar to Seminole by Married-couple Households
In terms of married-couple households, the demographic groups most similar to Seminole are German Russian (44.0%, a difference of 0.070%), Central American (43.9%, a difference of 0.12%), French American Indian (44.1%, a difference of 0.15%), Immigrants from Kenya (44.1%, a difference of 0.16%), and Apache (43.9%, a difference of 0.17%).
| Demographics | Rating | Rank | Married-couple Households |
| Immigrants | El Salvador | 0.7 /100 | #245 | Tragic 44.3% |
| Immigrants | Cuba | 0.6 /100 | #246 | Tragic 44.2% |
| Immigrants | Morocco | 0.6 /100 | #247 | Tragic 44.2% |
| Yup'ik | 0.4 /100 | #248 | Tragic 44.1% |
| Immigrants | Kenya | 0.4 /100 | #249 | Tragic 44.1% |
| French American Indians | 0.4 /100 | #250 | Tragic 44.1% |
| German Russians | 0.4 /100 | #251 | Tragic 44.0% |
| Seminole | 0.4 /100 | #252 | Tragic 44.0% |
| Central Americans | 0.3 /100 | #253 | Tragic 43.9% |
| Apache | 0.3 /100 | #254 | Tragic 43.9% |
| Shoshone | 0.3 /100 | #255 | Tragic 43.9% |
| Ugandans | 0.3 /100 | #256 | Tragic 43.8% |
| Blackfeet | 0.2 /100 | #257 | Tragic 43.8% |
| Central American Indians | 0.2 /100 | #258 | Tragic 43.8% |
| Iroquois | 0.2 /100 | #259 | Tragic 43.7% |
Demographics Similar to Dutch West Indians by Married-couple Households
In terms of married-couple households, the demographic groups most similar to Dutch West Indians are Immigrants from Micronesia (44.9%, a difference of 0.020%), Immigrants from Cambodia (44.9%, a difference of 0.040%), Alsatian (44.8%, a difference of 0.10%), Salvadoran (44.7%, a difference of 0.29%), and Kenyan (44.7%, a difference of 0.42%).
| Demographics | Rating | Rank | Married-couple Households |
| Immigrants | Azores | 5.3 /100 | #218 | Tragic 45.2% |
| Nicaraguans | 5.3 /100 | #219 | Tragic 45.2% |
| Immigrants | Thailand | 5.1 /100 | #220 | Tragic 45.2% |
| Tlingit-Haida | 4.9 /100 | #221 | Tragic 45.1% |
| Immigrants | Laos | 4.6 /100 | #222 | Tragic 45.1% |
| Immigrants | Cambodia | 2.7 /100 | #223 | Tragic 44.9% |
| Immigrants | Micronesia | 2.6 /100 | #224 | Tragic 44.9% |
| Dutch West Indians | 2.6 /100 | #225 | Tragic 44.9% |
| Alsatians | 2.3 /100 | #226 | Tragic 44.8% |
| Salvadorans | 1.9 /100 | #227 | Tragic 44.7% |
| Kenyans | 1.7 /100 | #228 | Tragic 44.7% |
| Immigrants | Latin America | 1.6 /100 | #229 | Tragic 44.7% |
| Soviet Union | 1.6 /100 | #230 | Tragic 44.6% |
| Houma | 1.5 /100 | #231 | Tragic 44.6% |
| Marshallese | 1.5 /100 | #232 | Tragic 44.6% |