Seminole vs Indonesian Married-couple Households
COMPARE
Seminole
Indonesian
Married-couple Households
Married-couple Households Comparison
Seminole
Indonesians
44.0%
MARRIED-COUPLE HOUSEHOLDS
0.4/ 100
METRIC RATING
252nd/ 347
METRIC RANK
42.0%
MARRIED-COUPLE HOUSEHOLDS
0.0/ 100
METRIC RATING
292nd/ 347
METRIC RANK
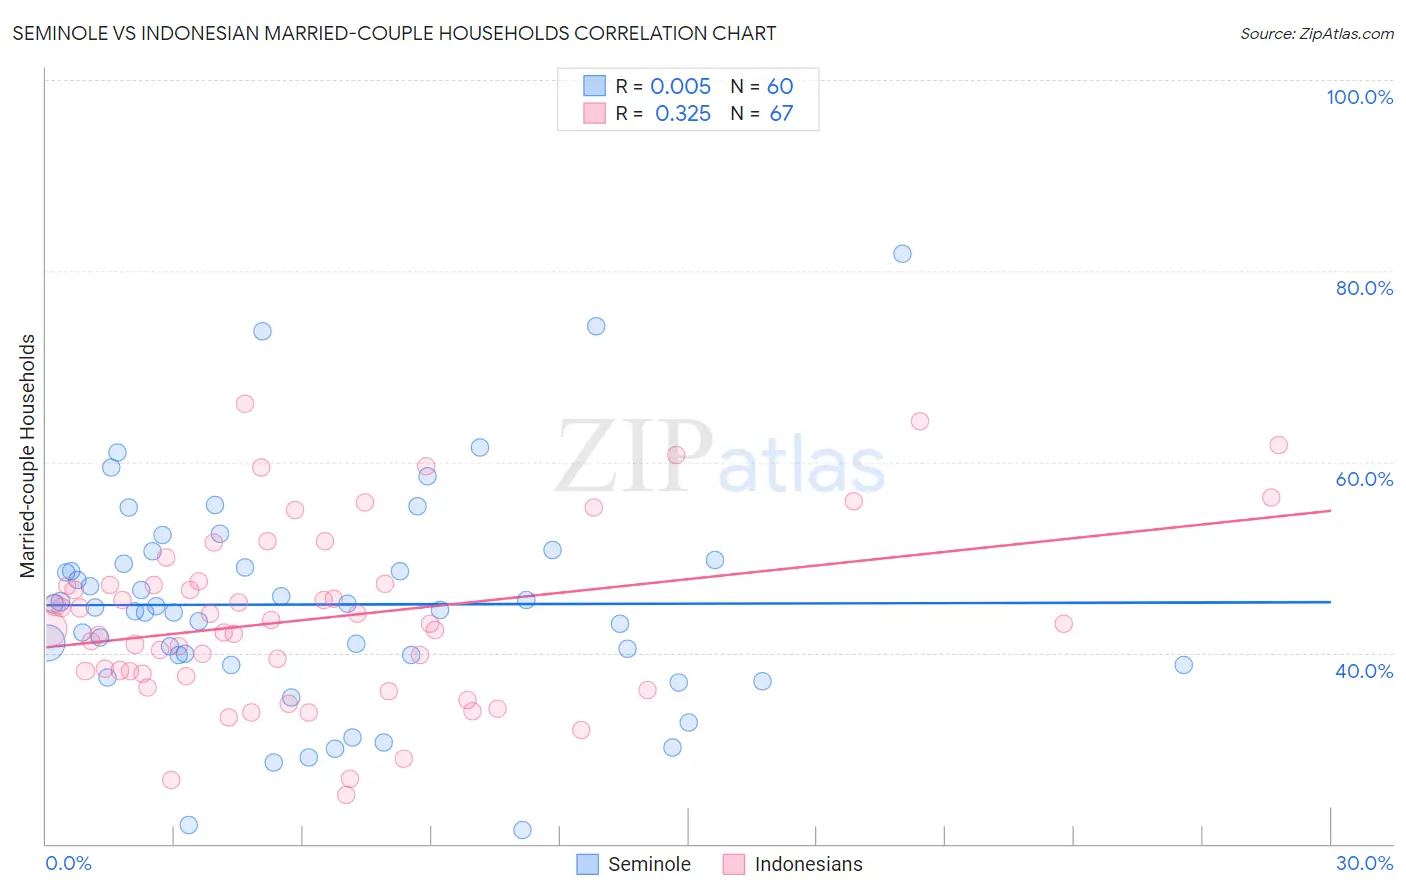
Seminole vs Indonesian Married-couple Households Correlation Chart
The statistical analysis conducted on geographies consisting of 118,298,576 people shows no correlation between the proportion of Seminole and percentage of married-couple family households in the United States with a correlation coefficient (R) of 0.005 and weighted average of 44.0%. Similarly, the statistical analysis conducted on geographies consisting of 162,636,634 people shows a mild positive correlation between the proportion of Indonesians and percentage of married-couple family households in the United States with a correlation coefficient (R) of 0.325 and weighted average of 42.0%, a difference of 4.6%.
Married-couple Households Correlation Summary
| Measurement | Seminole | Indonesian |
| Minimum | 21.4% | 25.1% |
| Maximum | 81.8% | 66.1% |
| Range | 60.4% | 41.1% |
| Mean | 45.1% | 43.7% |
| Median | 44.6% | 43.0% |
| Interquartile 25% (IQ1) | 39.2% | 37.8% |
| Interquartile 75% (IQ3) | 49.6% | 47.2% |
| Interquartile Range (IQR) | 10.3% | 9.4% |
| Standard Deviation (Sample) | 11.4% | 9.1% |
| Standard Deviation (Population) | 11.3% | 9.0% |
Similar Demographics by Married-couple Households
Demographics Similar to Seminole by Married-couple Households
In terms of married-couple households, the demographic groups most similar to Seminole are German Russian (44.0%, a difference of 0.070%), Central American (43.9%, a difference of 0.12%), French American Indian (44.1%, a difference of 0.15%), Immigrants from Kenya (44.1%, a difference of 0.16%), and Apache (43.9%, a difference of 0.17%).
| Demographics | Rating | Rank | Married-couple Households |
| Immigrants | El Salvador | 0.7 /100 | #245 | Tragic 44.3% |
| Immigrants | Cuba | 0.6 /100 | #246 | Tragic 44.2% |
| Immigrants | Morocco | 0.6 /100 | #247 | Tragic 44.2% |
| Yup'ik | 0.4 /100 | #248 | Tragic 44.1% |
| Immigrants | Kenya | 0.4 /100 | #249 | Tragic 44.1% |
| French American Indians | 0.4 /100 | #250 | Tragic 44.1% |
| German Russians | 0.4 /100 | #251 | Tragic 44.0% |
| Seminole | 0.4 /100 | #252 | Tragic 44.0% |
| Central Americans | 0.3 /100 | #253 | Tragic 43.9% |
| Apache | 0.3 /100 | #254 | Tragic 43.9% |
| Shoshone | 0.3 /100 | #255 | Tragic 43.9% |
| Ugandans | 0.3 /100 | #256 | Tragic 43.8% |
| Blackfeet | 0.2 /100 | #257 | Tragic 43.8% |
| Central American Indians | 0.2 /100 | #258 | Tragic 43.8% |
| Iroquois | 0.2 /100 | #259 | Tragic 43.7% |
Demographics Similar to Indonesians by Married-couple Households
In terms of married-couple households, the demographic groups most similar to Indonesians are Paiute (42.1%, a difference of 0.050%), Honduran (42.1%, a difference of 0.060%), Sudanese (42.1%, a difference of 0.11%), Menominee (42.0%, a difference of 0.11%), and Immigrants from Yemen (42.0%, a difference of 0.12%).
| Demographics | Rating | Rank | Married-couple Households |
| Ghanaians | 0.0 /100 | #285 | Tragic 42.2% |
| Belizeans | 0.0 /100 | #286 | Tragic 42.2% |
| Chippewa | 0.0 /100 | #287 | Tragic 42.1% |
| Immigrants | Eritrea | 0.0 /100 | #288 | Tragic 42.1% |
| Sudanese | 0.0 /100 | #289 | Tragic 42.1% |
| Hondurans | 0.0 /100 | #290 | Tragic 42.1% |
| Paiute | 0.0 /100 | #291 | Tragic 42.1% |
| Indonesians | 0.0 /100 | #292 | Tragic 42.0% |
| Menominee | 0.0 /100 | #293 | Tragic 42.0% |
| Immigrants | Yemen | 0.0 /100 | #294 | Tragic 42.0% |
| Kiowa | 0.0 /100 | #295 | Tragic 42.0% |
| Immigrants | Sudan | 0.0 /100 | #296 | Tragic 41.9% |
| Arapaho | 0.0 /100 | #297 | Tragic 41.8% |
| Immigrants | Middle Africa | 0.0 /100 | #298 | Tragic 41.8% |
| Immigrants | Ghana | 0.0 /100 | #299 | Tragic 41.8% |