Seminole vs Sri Lankan Married-couple Households
COMPARE
Seminole
Sri Lankan
Married-couple Households
Married-couple Households Comparison
Seminole
Sri Lankans
44.0%
MARRIED-COUPLE HOUSEHOLDS
0.4/ 100
METRIC RATING
252nd/ 347
METRIC RANK
49.0%
MARRIED-COUPLE HOUSEHOLDS
99.7/ 100
METRIC RATING
37th/ 347
METRIC RANK
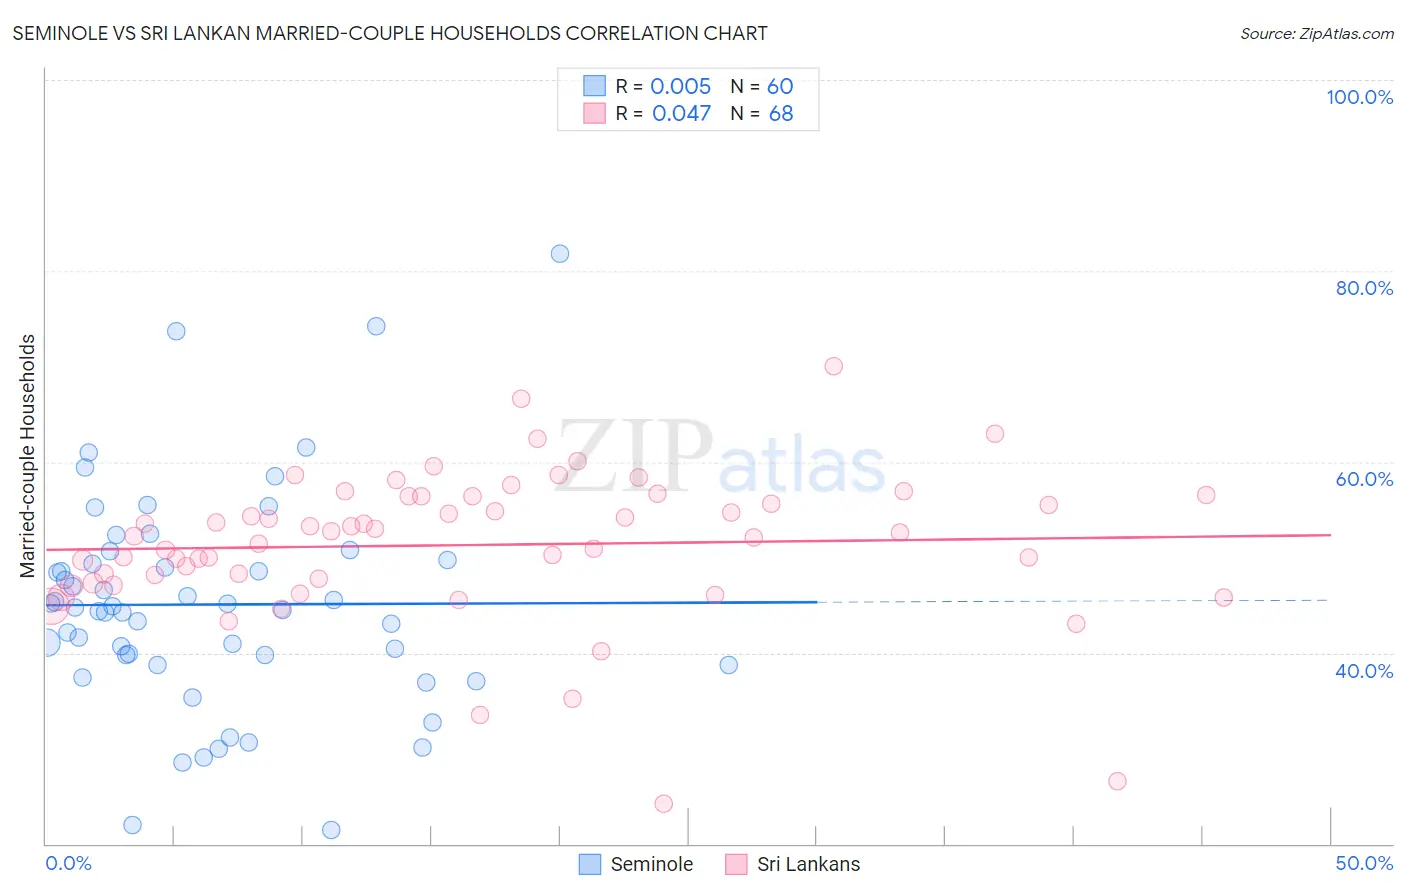
Seminole vs Sri Lankan Married-couple Households Correlation Chart
The statistical analysis conducted on geographies consisting of 118,298,576 people shows no correlation between the proportion of Seminole and percentage of married-couple family households in the United States with a correlation coefficient (R) of 0.005 and weighted average of 44.0%. Similarly, the statistical analysis conducted on geographies consisting of 440,079,035 people shows no correlation between the proportion of Sri Lankans and percentage of married-couple family households in the United States with a correlation coefficient (R) of 0.047 and weighted average of 49.0%, a difference of 11.3%.
Married-couple Households Correlation Summary
| Measurement | Seminole | Sri Lankan |
| Minimum | 21.4% | 24.2% |
| Maximum | 81.8% | 70.0% |
| Range | 60.4% | 45.7% |
| Mean | 45.1% | 51.3% |
| Median | 44.6% | 52.4% |
| Interquartile 25% (IQ1) | 39.2% | 47.6% |
| Interquartile 75% (IQ3) | 49.6% | 56.4% |
| Interquartile Range (IQR) | 10.3% | 8.8% |
| Standard Deviation (Sample) | 11.4% | 7.8% |
| Standard Deviation (Population) | 11.3% | 7.7% |
Similar Demographics by Married-couple Households
Demographics Similar to Seminole by Married-couple Households
In terms of married-couple households, the demographic groups most similar to Seminole are German Russian (44.0%, a difference of 0.070%), Central American (43.9%, a difference of 0.12%), French American Indian (44.1%, a difference of 0.15%), Immigrants from Kenya (44.1%, a difference of 0.16%), and Apache (43.9%, a difference of 0.17%).
| Demographics | Rating | Rank | Married-couple Households |
| Immigrants | El Salvador | 0.7 /100 | #245 | Tragic 44.3% |
| Immigrants | Cuba | 0.6 /100 | #246 | Tragic 44.2% |
| Immigrants | Morocco | 0.6 /100 | #247 | Tragic 44.2% |
| Yup'ik | 0.4 /100 | #248 | Tragic 44.1% |
| Immigrants | Kenya | 0.4 /100 | #249 | Tragic 44.1% |
| French American Indians | 0.4 /100 | #250 | Tragic 44.1% |
| German Russians | 0.4 /100 | #251 | Tragic 44.0% |
| Seminole | 0.4 /100 | #252 | Tragic 44.0% |
| Central Americans | 0.3 /100 | #253 | Tragic 43.9% |
| Apache | 0.3 /100 | #254 | Tragic 43.9% |
| Shoshone | 0.3 /100 | #255 | Tragic 43.9% |
| Ugandans | 0.3 /100 | #256 | Tragic 43.8% |
| Blackfeet | 0.2 /100 | #257 | Tragic 43.8% |
| Central American Indians | 0.2 /100 | #258 | Tragic 43.8% |
| Iroquois | 0.2 /100 | #259 | Tragic 43.7% |
Demographics Similar to Sri Lankans by Married-couple Households
In terms of married-couple households, the demographic groups most similar to Sri Lankans are Iranian (49.0%, a difference of 0.0%), Scottish (49.0%, a difference of 0.090%), Greek (48.9%, a difference of 0.090%), Italian (49.0%, a difference of 0.11%), and Lithuanian (48.9%, a difference of 0.18%).
| Demographics | Rating | Rank | Married-couple Households |
| Bolivians | 99.8 /100 | #30 | Exceptional 49.2% |
| Native Hawaiians | 99.8 /100 | #31 | Exceptional 49.1% |
| Hungarians | 99.8 /100 | #32 | Exceptional 49.1% |
| Immigrants | Asia | 99.7 /100 | #33 | Exceptional 49.1% |
| Italians | 99.7 /100 | #34 | Exceptional 49.0% |
| Scottish | 99.7 /100 | #35 | Exceptional 49.0% |
| Iranians | 99.7 /100 | #36 | Exceptional 49.0% |
| Sri Lankans | 99.7 /100 | #37 | Exceptional 49.0% |
| Greeks | 99.7 /100 | #38 | Exceptional 48.9% |
| Lithuanians | 99.6 /100 | #39 | Exceptional 48.9% |
| Immigrants | Bolivia | 99.6 /100 | #40 | Exceptional 48.9% |
| Immigrants | Lebanon | 99.6 /100 | #41 | Exceptional 48.9% |
| Immigrants | Vietnam | 99.6 /100 | #42 | Exceptional 48.8% |
| Immigrants | Iran | 99.6 /100 | #43 | Exceptional 48.8% |
| Welsh | 99.5 /100 | #44 | Exceptional 48.8% |