European vs Immigrants from Western Asia Average Family Size
COMPARE
European
Immigrants from Western Asia
Average Family Size
Average Family Size Comparison
Europeans
Immigrants from Western Asia
3.14
AVERAGE FAMILY SIZE
0.2/ 100
METRIC RATING
292nd/ 347
METRIC RANK
3.26
AVERAGE FAMILY SIZE
87.7/ 100
METRIC RATING
131st/ 347
METRIC RANK
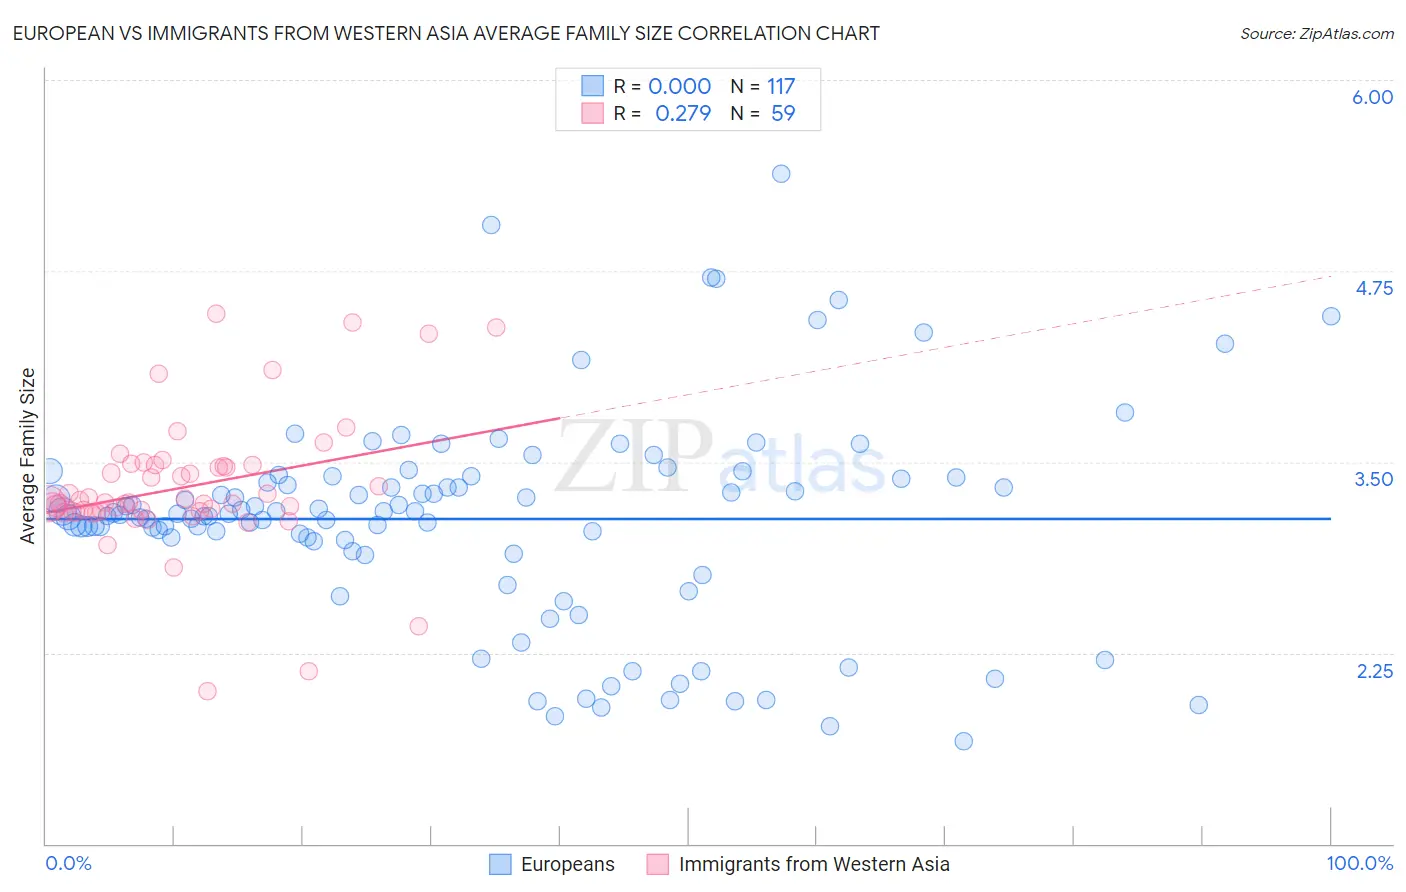
European vs Immigrants from Western Asia Average Family Size Correlation Chart
The statistical analysis conducted on geographies consisting of 561,245,179 people shows no correlation between the proportion of Europeans and average family size in the United States with a correlation coefficient (R) of 0.000 and weighted average of 3.14. Similarly, the statistical analysis conducted on geographies consisting of 404,181,617 people shows a weak positive correlation between the proportion of Immigrants from Western Asia and average family size in the United States with a correlation coefficient (R) of 0.279 and weighted average of 3.26, a difference of 3.7%.
Average Family Size Correlation Summary
| Measurement | European | Immigrants from Western Asia |
| Minimum | 1.67 | 2.00 |
| Maximum | 5.39 | 4.47 |
| Range | 3.72 | 2.47 |
| Mean | 3.13 | 3.33 |
| Median | 3.16 | 3.23 |
| Interquartile 25% (IQ1) | 2.95 | 3.17 |
| Interquartile 75% (IQ3) | 3.40 | 3.48 |
| Interquartile Range (IQR) | 0.45 | 0.30 |
| Standard Deviation (Sample) | 0.68 | 0.44 |
| Standard Deviation (Population) | 0.68 | 0.44 |
Similar Demographics by Average Family Size
Demographics Similar to Europeans by Average Family Size
In terms of average family size, the demographic groups most similar to Europeans are Scandinavian (3.14, a difference of 0.010%), Alsatian (3.14, a difference of 0.020%), Immigrants from Croatia (3.14, a difference of 0.030%), Austrian (3.14, a difference of 0.030%), and Ukrainian (3.14, a difference of 0.030%).
| Demographics | Rating | Rank | Average Family Size |
| Whites/Caucasians | 0.3 /100 | #285 | Tragic 3.14 |
| Immigrants | Netherlands | 0.3 /100 | #286 | Tragic 3.14 |
| Greeks | 0.3 /100 | #287 | Tragic 3.14 |
| Immigrants | Czechoslovakia | 0.3 /100 | #288 | Tragic 3.14 |
| Immigrants | Norway | 0.3 /100 | #289 | Tragic 3.14 |
| Cypriots | 0.3 /100 | #290 | Tragic 3.14 |
| Alsatians | 0.2 /100 | #291 | Tragic 3.14 |
| Europeans | 0.2 /100 | #292 | Tragic 3.14 |
| Scandinavians | 0.2 /100 | #293 | Tragic 3.14 |
| Immigrants | Croatia | 0.2 /100 | #294 | Tragic 3.14 |
| Austrians | 0.2 /100 | #295 | Tragic 3.14 |
| Ukrainians | 0.2 /100 | #296 | Tragic 3.14 |
| Immigrants | Western Europe | 0.2 /100 | #297 | Tragic 3.14 |
| Colville | 0.2 /100 | #298 | Tragic 3.14 |
| Canadians | 0.2 /100 | #299 | Tragic 3.14 |
Demographics Similar to Immigrants from Western Asia by Average Family Size
In terms of average family size, the demographic groups most similar to Immigrants from Western Asia are Laotian (3.26, a difference of 0.030%), Immigrants from Hong Kong (3.26, a difference of 0.040%), Costa Rican (3.26, a difference of 0.040%), Immigrants from Venezuela (3.26, a difference of 0.060%), and Colombian (3.26, a difference of 0.10%).
| Demographics | Rating | Rank | Average Family Size |
| South American Indians | 91.6 /100 | #124 | Exceptional 3.26 |
| Immigrants | Cuba | 91.3 /100 | #125 | Exceptional 3.26 |
| Immigrants | Costa Rica | 90.7 /100 | #126 | Exceptional 3.26 |
| Immigrants | Syria | 90.6 /100 | #127 | Exceptional 3.26 |
| Colombians | 89.9 /100 | #128 | Excellent 3.26 |
| Immigrants | Hong Kong | 88.6 /100 | #129 | Excellent 3.26 |
| Laotians | 88.5 /100 | #130 | Excellent 3.26 |
| Immigrants | Western Asia | 87.7 /100 | #131 | Excellent 3.26 |
| Costa Ricans | 86.8 /100 | #132 | Excellent 3.26 |
| Immigrants | Venezuela | 86.3 /100 | #133 | Excellent 3.26 |
| Africans | 84.9 /100 | #134 | Excellent 3.25 |
| Panamanians | 84.2 /100 | #135 | Excellent 3.25 |
| Comanche | 82.8 /100 | #136 | Excellent 3.25 |
| Immigrants | Middle Africa | 82.4 /100 | #137 | Excellent 3.25 |
| Cubans | 81.8 /100 | #138 | Excellent 3.25 |