Immigrants from Argentina vs Immigrants from Western Asia Average Family Size
COMPARE
Immigrants from Argentina
Immigrants from Western Asia
Average Family Size
Average Family Size Comparison
Immigrants from Argentina
Immigrants from Western Asia
3.22
AVERAGE FAMILY SIZE
39.8/ 100
METRIC RATING
186th/ 347
METRIC RANK
3.26
AVERAGE FAMILY SIZE
87.7/ 100
METRIC RATING
131st/ 347
METRIC RANK
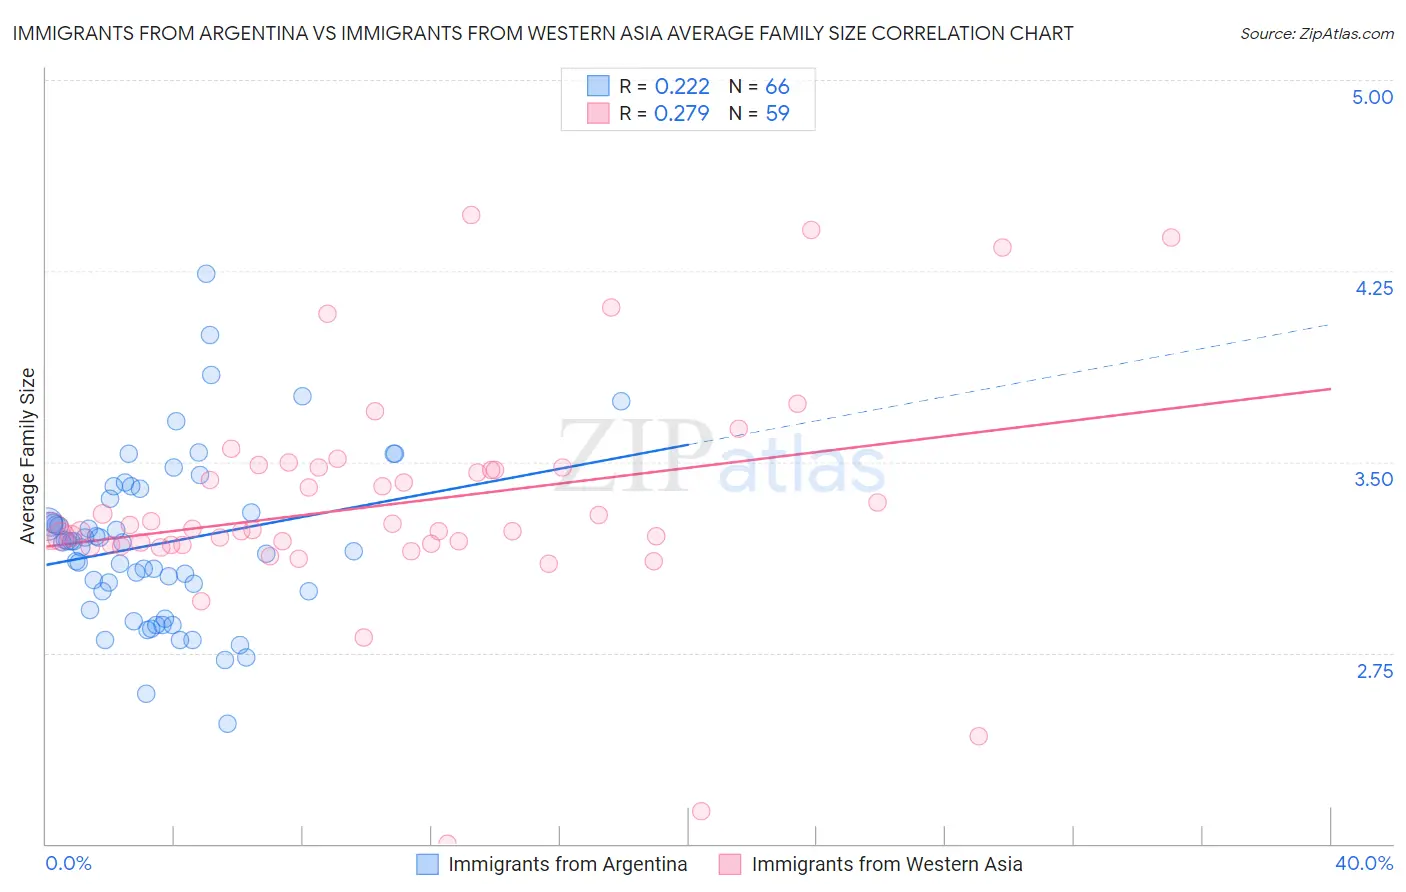
Immigrants from Argentina vs Immigrants from Western Asia Average Family Size Correlation Chart
The statistical analysis conducted on geographies consisting of 264,360,356 people shows a weak positive correlation between the proportion of Immigrants from Argentina and average family size in the United States with a correlation coefficient (R) of 0.222 and weighted average of 3.22. Similarly, the statistical analysis conducted on geographies consisting of 404,181,617 people shows a weak positive correlation between the proportion of Immigrants from Western Asia and average family size in the United States with a correlation coefficient (R) of 0.279 and weighted average of 3.26, a difference of 1.1%.
Average Family Size Correlation Summary
| Measurement | Immigrants from Argentina | Immigrants from Western Asia |
| Minimum | 2.47 | 2.00 |
| Maximum | 4.24 | 4.47 |
| Range | 1.77 | 2.47 |
| Mean | 3.18 | 3.33 |
| Median | 3.18 | 3.23 |
| Interquartile 25% (IQ1) | 2.99 | 3.17 |
| Interquartile 75% (IQ3) | 3.36 | 3.48 |
| Interquartile Range (IQR) | 0.37 | 0.30 |
| Standard Deviation (Sample) | 0.33 | 0.44 |
| Standard Deviation (Population) | 0.32 | 0.44 |
Similar Demographics by Average Family Size
Demographics Similar to Immigrants from Argentina by Average Family Size
In terms of average family size, the demographic groups most similar to Immigrants from Argentina are Immigrants from Sri Lanka (3.22, a difference of 0.0%), Immigrants from Eastern Asia (3.22, a difference of 0.020%), Immigrants from Malaysia (3.22, a difference of 0.020%), Thai (3.22, a difference of 0.030%), and Immigrants from Northern Africa (3.22, a difference of 0.040%).
| Demographics | Rating | Rank | Average Family Size |
| Immigrants | Korea | 46.9 /100 | #179 | Average 3.23 |
| Palestinians | 46.6 /100 | #180 | Average 3.23 |
| Spanish | 44.8 /100 | #181 | Average 3.23 |
| Moroccans | 44.2 /100 | #182 | Average 3.22 |
| Immigrants | Northern Africa | 41.7 /100 | #183 | Average 3.22 |
| Immigrants | Eastern Asia | 40.8 /100 | #184 | Average 3.22 |
| Immigrants | Sri Lanka | 39.8 /100 | #185 | Fair 3.22 |
| Immigrants | Argentina | 39.8 /100 | #186 | Fair 3.22 |
| Immigrants | Malaysia | 39.0 /100 | #187 | Fair 3.22 |
| Thais | 38.3 /100 | #188 | Fair 3.22 |
| Pakistanis | 33.7 /100 | #189 | Fair 3.22 |
| Burmese | 31.0 /100 | #190 | Fair 3.22 |
| Immigrants | Zaire | 30.5 /100 | #191 | Fair 3.22 |
| Immigrants | Eastern Africa | 30.1 /100 | #192 | Fair 3.22 |
| Immigrants | Israel | 29.3 /100 | #193 | Fair 3.22 |
Demographics Similar to Immigrants from Western Asia by Average Family Size
In terms of average family size, the demographic groups most similar to Immigrants from Western Asia are Laotian (3.26, a difference of 0.030%), Immigrants from Hong Kong (3.26, a difference of 0.040%), Costa Rican (3.26, a difference of 0.040%), Immigrants from Venezuela (3.26, a difference of 0.060%), and Colombian (3.26, a difference of 0.10%).
| Demographics | Rating | Rank | Average Family Size |
| South American Indians | 91.6 /100 | #124 | Exceptional 3.26 |
| Immigrants | Cuba | 91.3 /100 | #125 | Exceptional 3.26 |
| Immigrants | Costa Rica | 90.7 /100 | #126 | Exceptional 3.26 |
| Immigrants | Syria | 90.6 /100 | #127 | Exceptional 3.26 |
| Colombians | 89.9 /100 | #128 | Excellent 3.26 |
| Immigrants | Hong Kong | 88.6 /100 | #129 | Excellent 3.26 |
| Laotians | 88.5 /100 | #130 | Excellent 3.26 |
| Immigrants | Western Asia | 87.7 /100 | #131 | Excellent 3.26 |
| Costa Ricans | 86.8 /100 | #132 | Excellent 3.26 |
| Immigrants | Venezuela | 86.3 /100 | #133 | Excellent 3.26 |
| Africans | 84.9 /100 | #134 | Excellent 3.25 |
| Panamanians | 84.2 /100 | #135 | Excellent 3.25 |
| Comanche | 82.8 /100 | #136 | Excellent 3.25 |
| Immigrants | Middle Africa | 82.4 /100 | #137 | Excellent 3.25 |
| Cubans | 81.8 /100 | #138 | Excellent 3.25 |