Bulgarian vs Immigrants from Western Asia Average Family Size
COMPARE
Bulgarian
Immigrants from Western Asia
Average Family Size
Average Family Size Comparison
Bulgarians
Immigrants from Western Asia
3.13
AVERAGE FAMILY SIZE
0.1/ 100
METRIC RATING
313th/ 347
METRIC RANK
3.26
AVERAGE FAMILY SIZE
87.7/ 100
METRIC RATING
131st/ 347
METRIC RANK
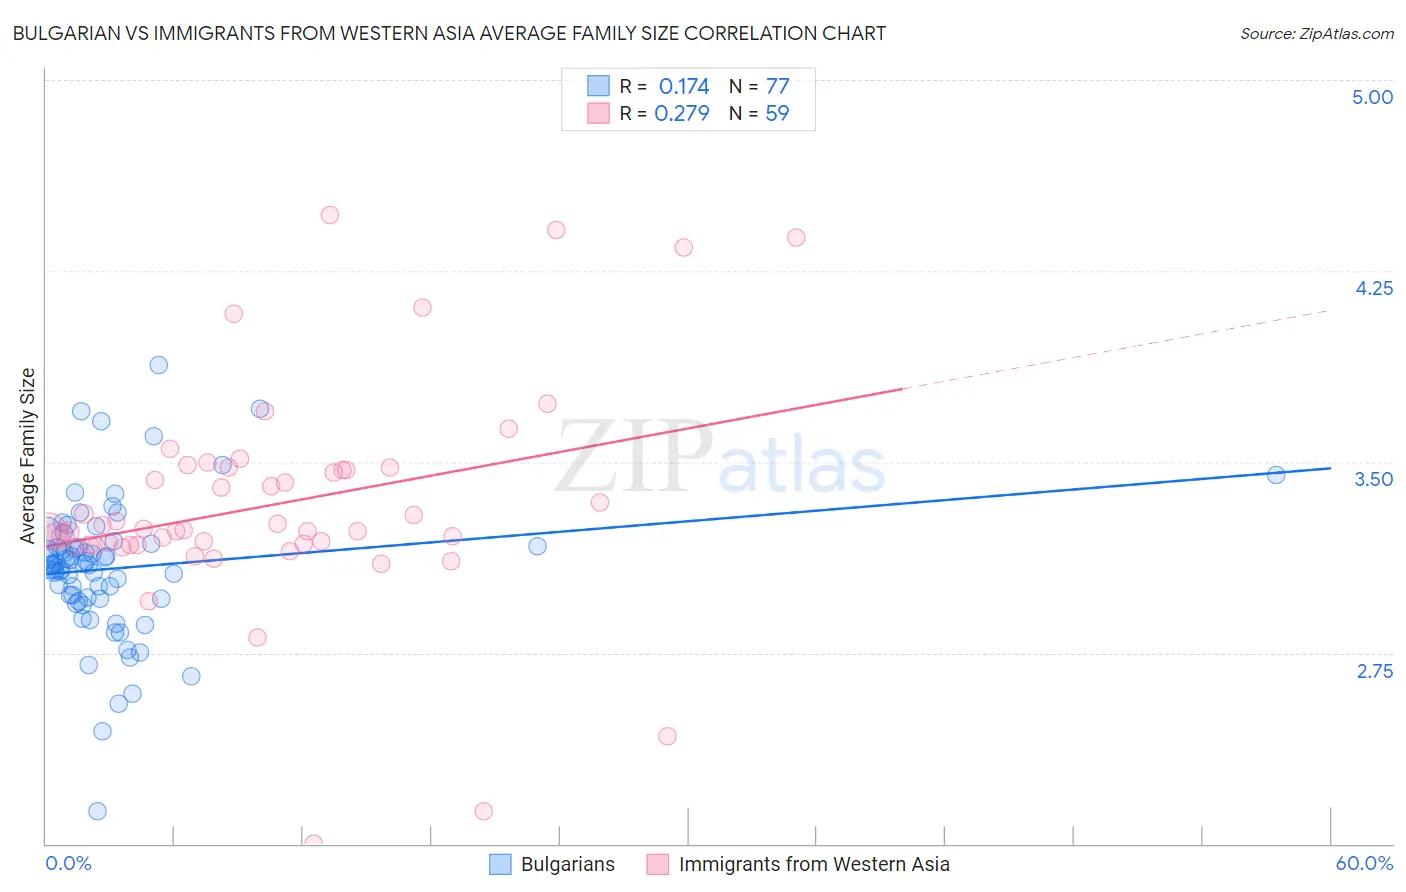
Bulgarian vs Immigrants from Western Asia Average Family Size Correlation Chart
The statistical analysis conducted on geographies consisting of 205,566,985 people shows a poor positive correlation between the proportion of Bulgarians and average family size in the United States with a correlation coefficient (R) of 0.174 and weighted average of 3.13. Similarly, the statistical analysis conducted on geographies consisting of 404,181,617 people shows a weak positive correlation between the proportion of Immigrants from Western Asia and average family size in the United States with a correlation coefficient (R) of 0.279 and weighted average of 3.26, a difference of 4.2%.
Average Family Size Correlation Summary
| Measurement | Bulgarian | Immigrants from Western Asia |
| Minimum | 2.13 | 2.00 |
| Maximum | 3.88 | 4.47 |
| Range | 1.75 | 2.47 |
| Mean | 3.08 | 3.33 |
| Median | 3.09 | 3.23 |
| Interquartile 25% (IQ1) | 2.96 | 3.17 |
| Interquartile 75% (IQ3) | 3.17 | 3.48 |
| Interquartile Range (IQR) | 0.21 | 0.30 |
| Standard Deviation (Sample) | 0.28 | 0.44 |
| Standard Deviation (Population) | 0.27 | 0.44 |
Similar Demographics by Average Family Size
Demographics Similar to Bulgarians by Average Family Size
In terms of average family size, the demographic groups most similar to Bulgarians are Immigrants from Australia (3.13, a difference of 0.0%), Immigrants from Northern Europe (3.13, a difference of 0.030%), Russian (3.12, a difference of 0.040%), Immigrants from Scotland (3.12, a difference of 0.060%), and Czechoslovakian (3.13, a difference of 0.070%).
| Demographics | Rating | Rank | Average Family Size |
| Immigrants | Ireland | 0.1 /100 | #306 | Tragic 3.13 |
| Immigrants | Serbia | 0.1 /100 | #307 | Tragic 3.13 |
| Slavs | 0.1 /100 | #308 | Tragic 3.13 |
| Northern Europeans | 0.1 /100 | #309 | Tragic 3.13 |
| Czechoslovakians | 0.1 /100 | #310 | Tragic 3.13 |
| Immigrants | Northern Europe | 0.1 /100 | #311 | Tragic 3.13 |
| Immigrants | Australia | 0.1 /100 | #312 | Tragic 3.13 |
| Bulgarians | 0.1 /100 | #313 | Tragic 3.13 |
| Russians | 0.1 /100 | #314 | Tragic 3.12 |
| Immigrants | Scotland | 0.1 /100 | #315 | Tragic 3.12 |
| Serbians | 0.1 /100 | #316 | Tragic 3.12 |
| Italians | 0.1 /100 | #317 | Tragic 3.12 |
| Eastern Europeans | 0.1 /100 | #318 | Tragic 3.12 |
| Welsh | 0.1 /100 | #319 | Tragic 3.12 |
| Immigrants | North America | 0.0 /100 | #320 | Tragic 3.12 |
Demographics Similar to Immigrants from Western Asia by Average Family Size
In terms of average family size, the demographic groups most similar to Immigrants from Western Asia are Laotian (3.26, a difference of 0.030%), Immigrants from Hong Kong (3.26, a difference of 0.040%), Costa Rican (3.26, a difference of 0.040%), Immigrants from Venezuela (3.26, a difference of 0.060%), and Colombian (3.26, a difference of 0.10%).
| Demographics | Rating | Rank | Average Family Size |
| South American Indians | 91.6 /100 | #124 | Exceptional 3.26 |
| Immigrants | Cuba | 91.3 /100 | #125 | Exceptional 3.26 |
| Immigrants | Costa Rica | 90.7 /100 | #126 | Exceptional 3.26 |
| Immigrants | Syria | 90.6 /100 | #127 | Exceptional 3.26 |
| Colombians | 89.9 /100 | #128 | Excellent 3.26 |
| Immigrants | Hong Kong | 88.6 /100 | #129 | Excellent 3.26 |
| Laotians | 88.5 /100 | #130 | Excellent 3.26 |
| Immigrants | Western Asia | 87.7 /100 | #131 | Excellent 3.26 |
| Costa Ricans | 86.8 /100 | #132 | Excellent 3.26 |
| Immigrants | Venezuela | 86.3 /100 | #133 | Excellent 3.26 |
| Africans | 84.9 /100 | #134 | Excellent 3.25 |
| Panamanians | 84.2 /100 | #135 | Excellent 3.25 |
| Comanche | 82.8 /100 | #136 | Excellent 3.25 |
| Immigrants | Middle Africa | 82.4 /100 | #137 | Excellent 3.25 |
| Cubans | 81.8 /100 | #138 | Excellent 3.25 |