Houma vs Hmong Average Family Size
COMPARE
Houma
Hmong
Average Family Size
Average Family Size Comparison
Houma
Hmong
3.18
AVERAGE FAMILY SIZE
3.4/ 100
METRIC RATING
239th/ 347
METRIC RANK
3.21
AVERAGE FAMILY SIZE
20.7/ 100
METRIC RATING
199th/ 347
METRIC RANK
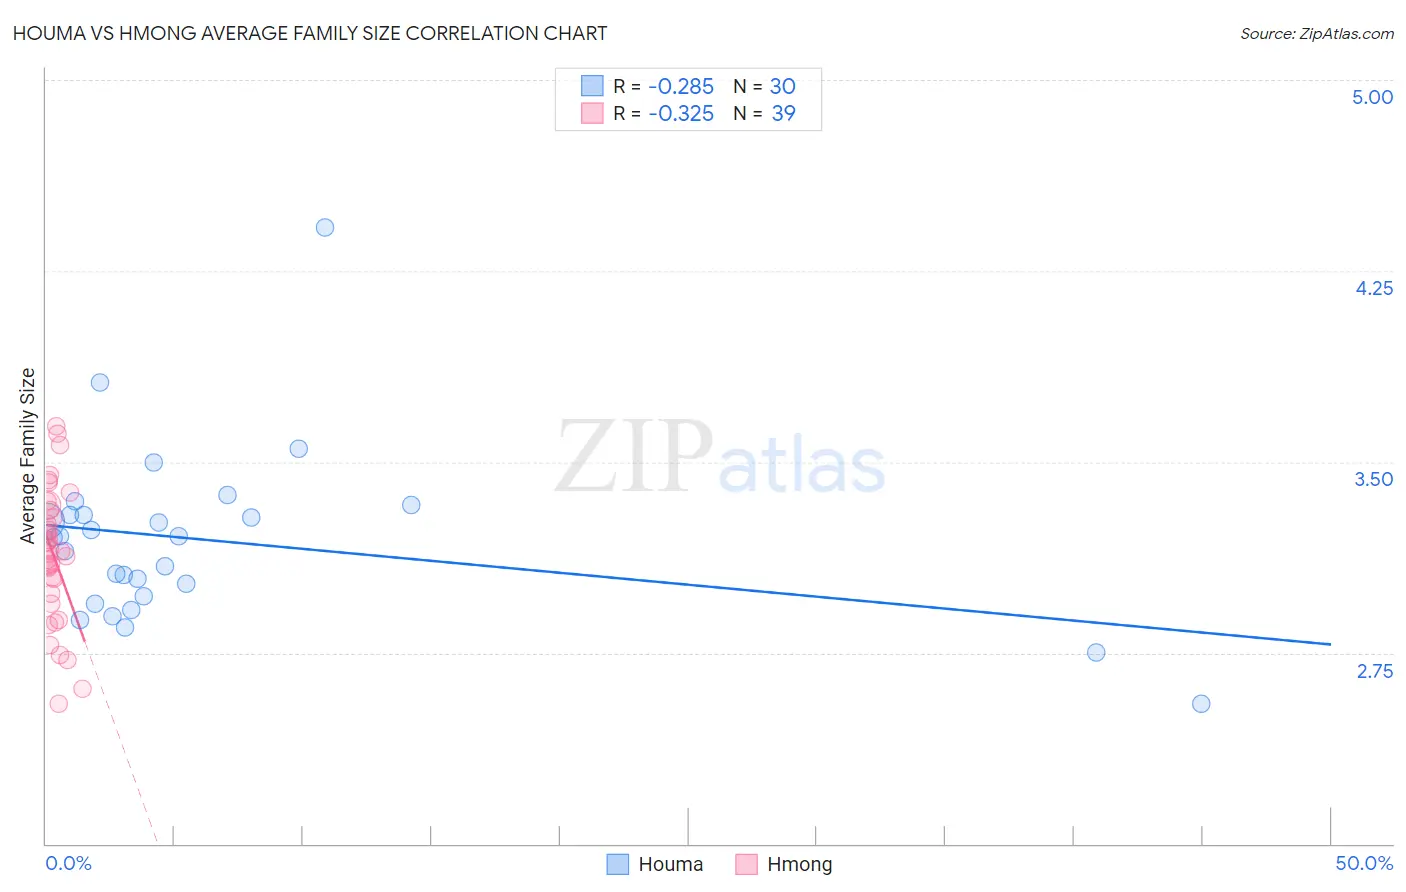
Houma vs Hmong Average Family Size Correlation Chart
The statistical analysis conducted on geographies consisting of 36,793,313 people shows a weak negative correlation between the proportion of Houma and average family size in the United States with a correlation coefficient (R) of -0.285 and weighted average of 3.18. Similarly, the statistical analysis conducted on geographies consisting of 24,678,157 people shows a mild negative correlation between the proportion of Hmong and average family size in the United States with a correlation coefficient (R) of -0.325 and weighted average of 3.21, a difference of 0.93%.
Average Family Size Correlation Summary
| Measurement | Houma | Hmong |
| Minimum | 2.55 | 2.55 |
| Maximum | 4.42 | 3.64 |
| Range | 1.87 | 1.09 |
| Mean | 3.19 | 3.14 |
| Median | 3.20 | 3.15 |
| Interquartile 25% (IQ1) | 2.97 | 2.98 |
| Interquartile 75% (IQ3) | 3.29 | 3.31 |
| Interquartile Range (IQR) | 0.32 | 0.33 |
| Standard Deviation (Sample) | 0.34 | 0.26 |
| Standard Deviation (Population) | 0.34 | 0.26 |
Similar Demographics by Average Family Size
Demographics Similar to Houma by Average Family Size
In terms of average family size, the demographic groups most similar to Houma are Osage (3.18, a difference of 0.020%), Immigrants from Romania (3.18, a difference of 0.050%), Romanian (3.18, a difference of 0.050%), Immigrants from Japan (3.18, a difference of 0.050%), and Hungarian (3.18, a difference of 0.060%).
| Demographics | Rating | Rank | Average Family Size |
| Cherokee | 4.7 /100 | #232 | Tragic 3.18 |
| Brazilians | 4.5 /100 | #233 | Tragic 3.18 |
| Iranians | 4.5 /100 | #234 | Tragic 3.18 |
| Immigrants | Turkey | 4.2 /100 | #235 | Tragic 3.18 |
| Immigrants | Portugal | 4.2 /100 | #236 | Tragic 3.18 |
| Immigrants | Romania | 3.7 /100 | #237 | Tragic 3.18 |
| Romanians | 3.7 /100 | #238 | Tragic 3.18 |
| Houma | 3.4 /100 | #239 | Tragic 3.18 |
| Osage | 3.2 /100 | #240 | Tragic 3.18 |
| Immigrants | Japan | 3.0 /100 | #241 | Tragic 3.18 |
| Hungarians | 3.0 /100 | #242 | Tragic 3.18 |
| Immigrants | Moldova | 2.9 /100 | #243 | Tragic 3.18 |
| Immigrants | Southern Europe | 2.9 /100 | #244 | Tragic 3.18 |
| Immigrants | Brazil | 2.7 /100 | #245 | Tragic 3.18 |
| Danes | 2.5 /100 | #246 | Tragic 3.17 |
Demographics Similar to Hmong by Average Family Size
In terms of average family size, the demographic groups most similar to Hmong are Immigrants from the Azores (3.21, a difference of 0.020%), Immigrants from Kenya (3.21, a difference of 0.040%), Immigrants from Morocco (3.21, a difference of 0.060%), Immigrants from India (3.21, a difference of 0.070%), and Immigrants from Nepal (3.21, a difference of 0.080%).
| Demographics | Rating | Rank | Average Family Size |
| Immigrants | Eastern Africa | 30.1 /100 | #192 | Fair 3.22 |
| Immigrants | Israel | 29.3 /100 | #193 | Fair 3.22 |
| Immigrants | Sudan | 29.1 /100 | #194 | Fair 3.22 |
| Choctaw | 28.3 /100 | #195 | Fair 3.21 |
| Senegalese | 28.2 /100 | #196 | Fair 3.21 |
| Kenyans | 28.0 /100 | #197 | Fair 3.21 |
| Immigrants | Azores | 21.7 /100 | #198 | Fair 3.21 |
| Hmong | 20.7 /100 | #199 | Fair 3.21 |
| Immigrants | Kenya | 19.2 /100 | #200 | Poor 3.21 |
| Immigrants | Morocco | 18.5 /100 | #201 | Poor 3.21 |
| Immigrants | India | 18.5 /100 | #202 | Poor 3.21 |
| Immigrants | Nepal | 18.1 /100 | #203 | Poor 3.21 |
| Immigrants | Poland | 16.6 /100 | #204 | Poor 3.20 |
| Paraguayans | 16.3 /100 | #205 | Poor 3.20 |
| Immigrants | Cabo Verde | 16.0 /100 | #206 | Poor 3.20 |