Scandinavian vs Hmong Cognitive Disability
COMPARE
Scandinavian
Hmong
Cognitive Disability
Cognitive Disability Comparison
Scandinavians
Hmong
16.9%
COGNITIVE DISABILITY
94.1/ 100
METRIC RATING
125th/ 347
METRIC RANK
18.4%
COGNITIVE DISABILITY
0.0/ 100
METRIC RATING
311th/ 347
METRIC RANK
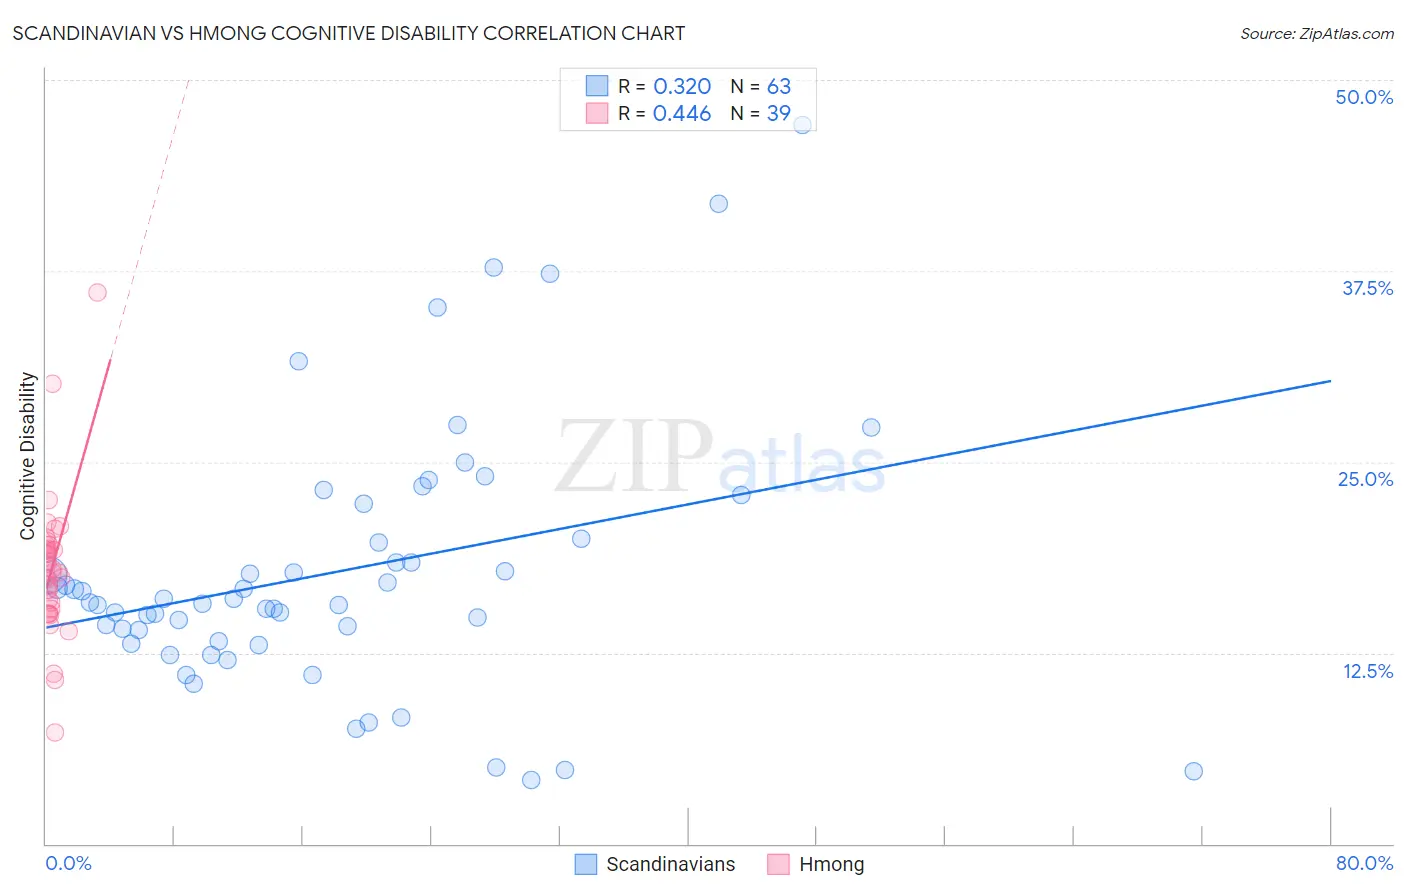
Scandinavian vs Hmong Cognitive Disability Correlation Chart
The statistical analysis conducted on geographies consisting of 472,549,780 people shows a mild positive correlation between the proportion of Scandinavians and percentage of population with cognitive disability in the United States with a correlation coefficient (R) of 0.320 and weighted average of 16.9%. Similarly, the statistical analysis conducted on geographies consisting of 24,607,802 people shows a moderate positive correlation between the proportion of Hmong and percentage of population with cognitive disability in the United States with a correlation coefficient (R) of 0.446 and weighted average of 18.4%, a difference of 8.9%.
Cognitive Disability Correlation Summary
| Measurement | Scandinavian | Hmong |
| Minimum | 4.2% | 7.3% |
| Maximum | 47.1% | 36.1% |
| Range | 42.9% | 28.8% |
| Mean | 17.8% | 18.0% |
| Median | 15.8% | 17.8% |
| Interquartile 25% (IQ1) | 13.3% | 15.4% |
| Interquartile 75% (IQ3) | 20.0% | 19.6% |
| Interquartile Range (IQR) | 6.7% | 4.2% |
| Standard Deviation (Sample) | 8.6% | 4.7% |
| Standard Deviation (Population) | 8.5% | 4.6% |
Similar Demographics by Cognitive Disability
Demographics Similar to Scandinavians by Cognitive Disability
In terms of cognitive disability, the demographic groups most similar to Scandinavians are Turkish (16.9%, a difference of 0.050%), Portuguese (16.9%, a difference of 0.080%), Immigrants from Western Europe (16.9%, a difference of 0.090%), European (17.0%, a difference of 0.090%), and Immigrants from China (16.9%, a difference of 0.10%).
| Demographics | Rating | Rank | Cognitive Disability |
| Immigrants | Denmark | 96.2 /100 | #118 | Exceptional 16.9% |
| South Africans | 95.5 /100 | #119 | Exceptional 16.9% |
| Scottish | 95.0 /100 | #120 | Exceptional 16.9% |
| Immigrants | China | 94.9 /100 | #121 | Exceptional 16.9% |
| Immigrants | Western Europe | 94.8 /100 | #122 | Exceptional 16.9% |
| Portuguese | 94.7 /100 | #123 | Exceptional 16.9% |
| Turks | 94.5 /100 | #124 | Exceptional 16.9% |
| Scandinavians | 94.1 /100 | #125 | Exceptional 16.9% |
| Europeans | 93.4 /100 | #126 | Exceptional 17.0% |
| Immigrants | Costa Rica | 93.1 /100 | #127 | Exceptional 17.0% |
| Nicaraguans | 93.0 /100 | #128 | Exceptional 17.0% |
| Immigrants | Uruguay | 92.9 /100 | #129 | Exceptional 17.0% |
| Immigrants | Vietnam | 92.4 /100 | #130 | Exceptional 17.0% |
| Immigrants | Germany | 92.1 /100 | #131 | Exceptional 17.0% |
| Whites/Caucasians | 92.1 /100 | #132 | Exceptional 17.0% |
Demographics Similar to Hmong by Cognitive Disability
In terms of cognitive disability, the demographic groups most similar to Hmong are Choctaw (18.4%, a difference of 0.030%), Chickasaw (18.5%, a difference of 0.29%), Yaqui (18.5%, a difference of 0.39%), Immigrants from Eastern Africa (18.4%, a difference of 0.40%), and Immigrants from Western Africa (18.4%, a difference of 0.44%).
| Demographics | Rating | Rank | Cognitive Disability |
| Immigrants | Eritrea | 0.0 /100 | #304 | Tragic 18.3% |
| Colville | 0.0 /100 | #305 | Tragic 18.3% |
| Seminole | 0.0 /100 | #306 | Tragic 18.3% |
| Ugandans | 0.0 /100 | #307 | Tragic 18.3% |
| Immigrants | Western Africa | 0.0 /100 | #308 | Tragic 18.4% |
| Immigrants | Eastern Africa | 0.0 /100 | #309 | Tragic 18.4% |
| Choctaw | 0.0 /100 | #310 | Tragic 18.4% |
| Hmong | 0.0 /100 | #311 | Tragic 18.4% |
| Chickasaw | 0.0 /100 | #312 | Tragic 18.5% |
| Yaqui | 0.0 /100 | #313 | Tragic 18.5% |
| Sub-Saharan Africans | 0.0 /100 | #314 | Tragic 18.5% |
| Immigrants | Dominica | 0.0 /100 | #315 | Tragic 18.6% |
| Immigrants | Middle Africa | 0.0 /100 | #316 | Tragic 18.6% |
| Liberians | 0.0 /100 | #317 | Tragic 18.6% |
| Bangladeshis | 0.0 /100 | #318 | Tragic 18.6% |