Thai vs Hmong Average Family Size
COMPARE
Thai
Hmong
Average Family Size
Average Family Size Comparison
Thais
Hmong
3.22
AVERAGE FAMILY SIZE
38.3/ 100
METRIC RATING
188th/ 347
METRIC RANK
3.21
AVERAGE FAMILY SIZE
20.7/ 100
METRIC RATING
199th/ 347
METRIC RANK
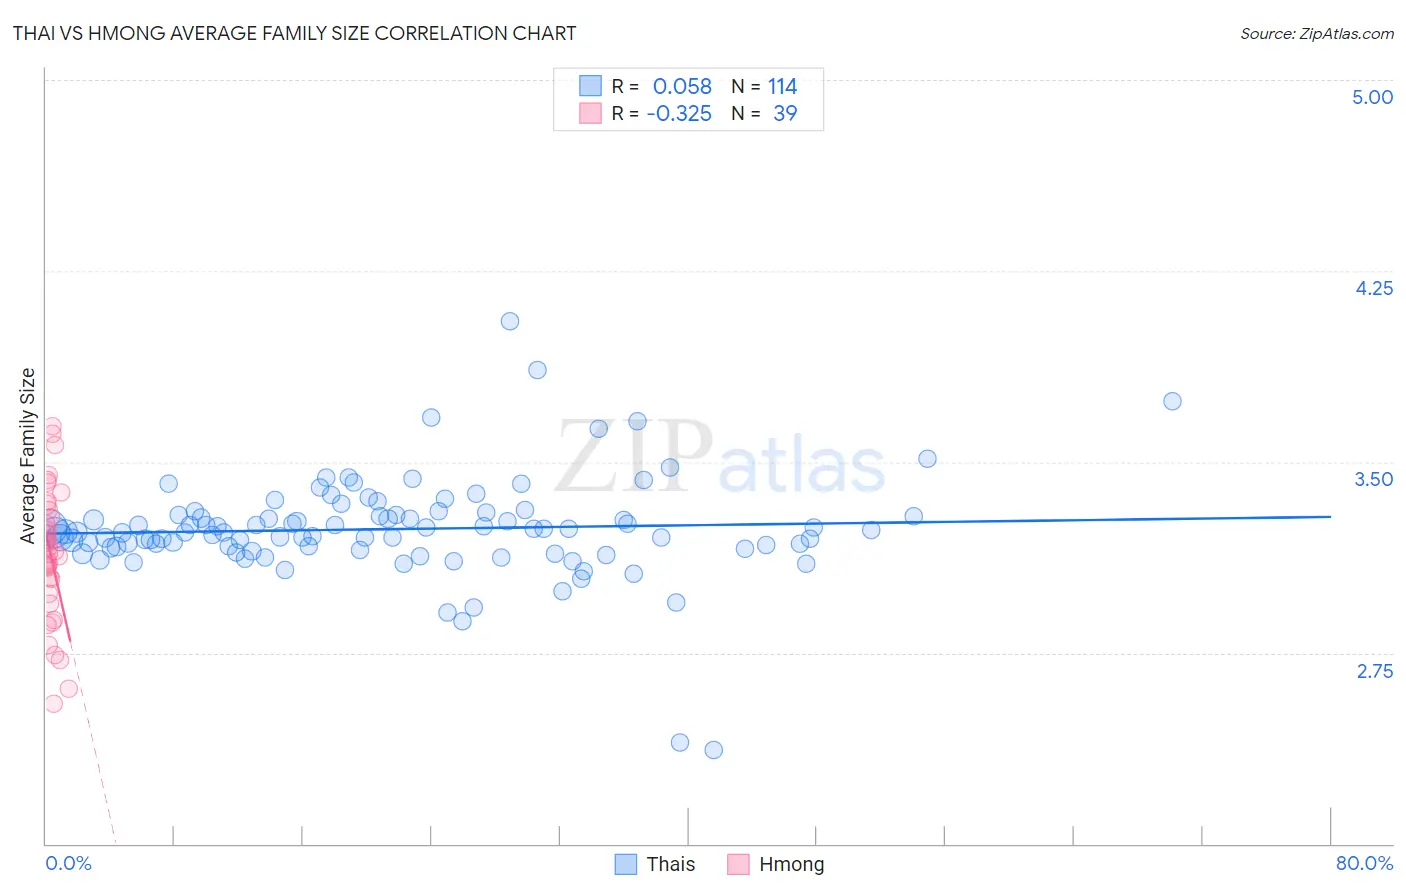
Thai vs Hmong Average Family Size Correlation Chart
The statistical analysis conducted on geographies consisting of 475,374,663 people shows a slight positive correlation between the proportion of Thais and average family size in the United States with a correlation coefficient (R) of 0.058 and weighted average of 3.22. Similarly, the statistical analysis conducted on geographies consisting of 24,678,157 people shows a mild negative correlation between the proportion of Hmong and average family size in the United States with a correlation coefficient (R) of -0.325 and weighted average of 3.21, a difference of 0.39%.
Average Family Size Correlation Summary
| Measurement | Thai | Hmong |
| Minimum | 2.37 | 2.55 |
| Maximum | 4.05 | 3.64 |
| Range | 1.68 | 1.09 |
| Mean | 3.24 | 3.14 |
| Median | 3.22 | 3.15 |
| Interquartile 25% (IQ1) | 3.16 | 2.98 |
| Interquartile 75% (IQ3) | 3.29 | 3.31 |
| Interquartile Range (IQR) | 0.13 | 0.33 |
| Standard Deviation (Sample) | 0.20 | 0.26 |
| Standard Deviation (Population) | 0.20 | 0.26 |
Demographics Similar to Thais and Hmong by Average Family Size
In terms of average family size, the demographic groups most similar to Thais are Immigrants from Malaysia (3.22, a difference of 0.010%), Immigrants from Sri Lanka (3.22, a difference of 0.030%), Immigrants from Argentina (3.22, a difference of 0.030%), Immigrants from Eastern Asia (3.22, a difference of 0.050%), and Immigrants from Northern Africa (3.22, a difference of 0.070%). Similarly, the demographic groups most similar to Hmong are Immigrants from the Azores (3.21, a difference of 0.020%), Immigrants from Kenya (3.21, a difference of 0.040%), Immigrants from Morocco (3.21, a difference of 0.060%), Immigrants from India (3.21, a difference of 0.070%), and Immigrants from Nepal (3.21, a difference of 0.080%).
| Demographics | Rating | Rank | Average Family Size |
| Immigrants | Northern Africa | 41.7 /100 | #183 | Average 3.22 |
| Immigrants | Eastern Asia | 40.8 /100 | #184 | Average 3.22 |
| Immigrants | Sri Lanka | 39.8 /100 | #185 | Fair 3.22 |
| Immigrants | Argentina | 39.8 /100 | #186 | Fair 3.22 |
| Immigrants | Malaysia | 39.0 /100 | #187 | Fair 3.22 |
| Thais | 38.3 /100 | #188 | Fair 3.22 |
| Pakistanis | 33.7 /100 | #189 | Fair 3.22 |
| Burmese | 31.0 /100 | #190 | Fair 3.22 |
| Immigrants | Zaire | 30.5 /100 | #191 | Fair 3.22 |
| Immigrants | Eastern Africa | 30.1 /100 | #192 | Fair 3.22 |
| Immigrants | Israel | 29.3 /100 | #193 | Fair 3.22 |
| Immigrants | Sudan | 29.1 /100 | #194 | Fair 3.22 |
| Choctaw | 28.3 /100 | #195 | Fair 3.21 |
| Senegalese | 28.2 /100 | #196 | Fair 3.21 |
| Kenyans | 28.0 /100 | #197 | Fair 3.21 |
| Immigrants | Azores | 21.7 /100 | #198 | Fair 3.21 |
| Hmong | 20.7 /100 | #199 | Fair 3.21 |
| Immigrants | Kenya | 19.2 /100 | #200 | Poor 3.21 |
| Immigrants | Morocco | 18.5 /100 | #201 | Poor 3.21 |
| Immigrants | India | 18.5 /100 | #202 | Poor 3.21 |
| Immigrants | Nepal | 18.1 /100 | #203 | Poor 3.21 |