Egyptian vs Hmong Average Family Size
COMPARE
Egyptian
Hmong
Average Family Size
Average Family Size Comparison
Egyptians
Hmong
3.23
AVERAGE FAMILY SIZE
58.6/ 100
METRIC RATING
164th/ 347
METRIC RANK
3.21
AVERAGE FAMILY SIZE
20.7/ 100
METRIC RATING
199th/ 347
METRIC RANK
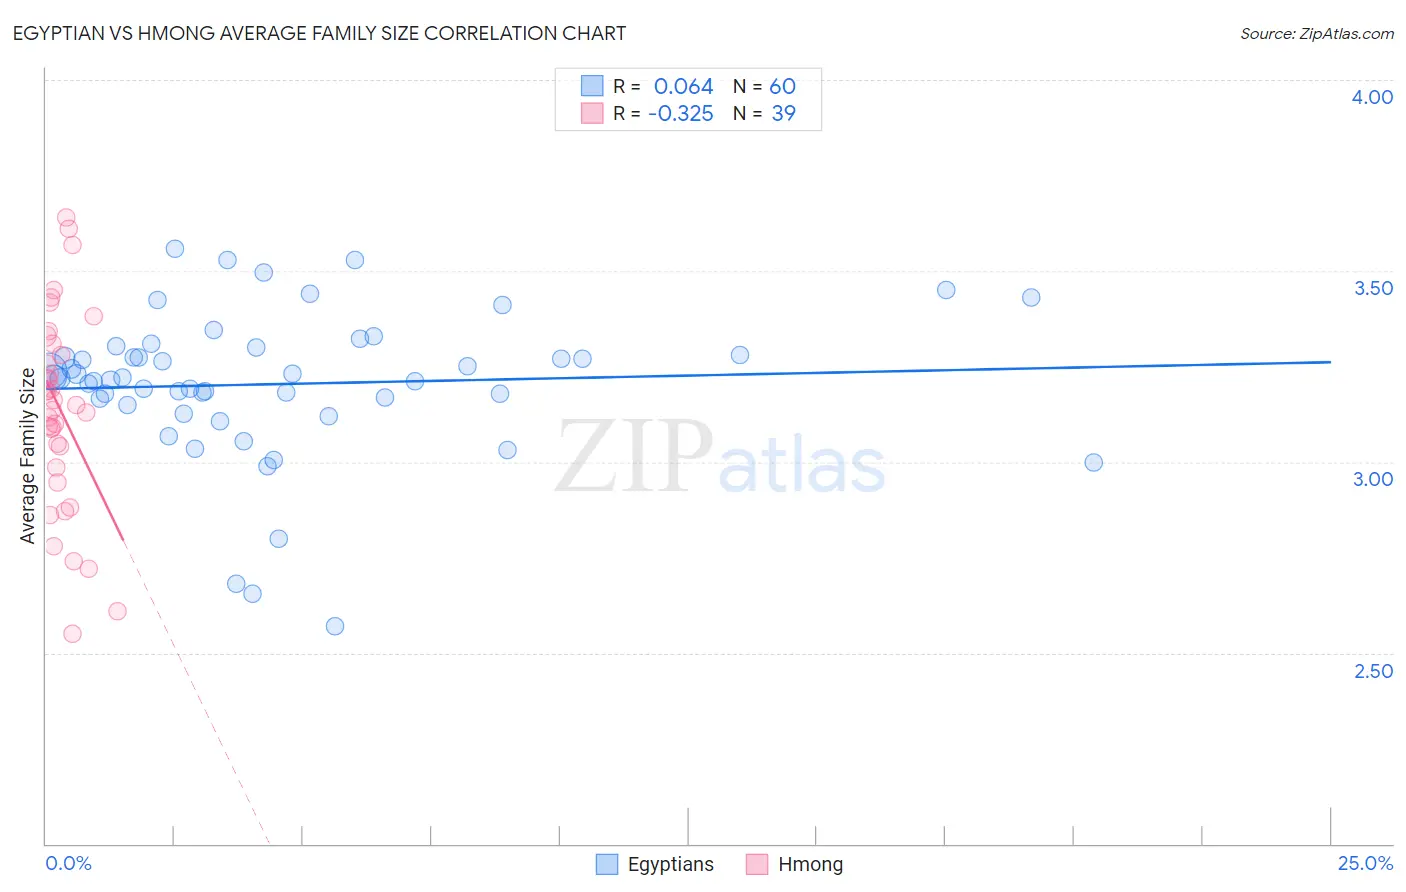
Egyptian vs Hmong Average Family Size Correlation Chart
The statistical analysis conducted on geographies consisting of 276,780,129 people shows a slight positive correlation between the proportion of Egyptians and average family size in the United States with a correlation coefficient (R) of 0.064 and weighted average of 3.23. Similarly, the statistical analysis conducted on geographies consisting of 24,678,157 people shows a mild negative correlation between the proportion of Hmong and average family size in the United States with a correlation coefficient (R) of -0.325 and weighted average of 3.21, a difference of 0.77%.
Average Family Size Correlation Summary
| Measurement | Egyptian | Hmong |
| Minimum | 2.57 | 2.55 |
| Maximum | 3.56 | 3.64 |
| Range | 0.99 | 1.09 |
| Mean | 3.20 | 3.14 |
| Median | 3.22 | 3.15 |
| Interquartile 25% (IQ1) | 3.16 | 2.98 |
| Interquartile 75% (IQ3) | 3.29 | 3.31 |
| Interquartile Range (IQR) | 0.13 | 0.33 |
| Standard Deviation (Sample) | 0.19 | 0.26 |
| Standard Deviation (Population) | 0.19 | 0.26 |
Similar Demographics by Average Family Size
Demographics Similar to Egyptians by Average Family Size
In terms of average family size, the demographic groups most similar to Egyptians are Uruguayan (3.23, a difference of 0.0%), Ugandan (3.23, a difference of 0.0%), Immigrants from Senegal (3.23, a difference of 0.020%), Immigrants from Uganda (3.23, a difference of 0.030%), and Dutch West Indian (3.23, a difference of 0.030%).
| Demographics | Rating | Rank | Average Family Size |
| Immigrants | Uzbekistan | 67.0 /100 | #157 | Good 3.24 |
| Iraqis | 64.3 /100 | #158 | Good 3.24 |
| Ethiopians | 63.9 /100 | #159 | Good 3.24 |
| Immigrants | Iraq | 63.7 /100 | #160 | Good 3.24 |
| Immigrants | Chile | 63.2 /100 | #161 | Good 3.24 |
| Immigrants | Uganda | 60.1 /100 | #162 | Good 3.23 |
| Uruguayans | 58.8 /100 | #163 | Average 3.23 |
| Egyptians | 58.6 /100 | #164 | Average 3.23 |
| Ugandans | 58.4 /100 | #165 | Average 3.23 |
| Immigrants | Senegal | 57.5 /100 | #166 | Average 3.23 |
| Dutch West Indians | 56.9 /100 | #167 | Average 3.23 |
| Taiwanese | 54.2 /100 | #168 | Average 3.23 |
| Aleuts | 54.1 /100 | #169 | Average 3.23 |
| Arabs | 53.8 /100 | #170 | Average 3.23 |
| Chileans | 53.2 /100 | #171 | Average 3.23 |
Demographics Similar to Hmong by Average Family Size
In terms of average family size, the demographic groups most similar to Hmong are Immigrants from the Azores (3.21, a difference of 0.020%), Immigrants from Kenya (3.21, a difference of 0.040%), Immigrants from Morocco (3.21, a difference of 0.060%), Immigrants from India (3.21, a difference of 0.070%), and Immigrants from Nepal (3.21, a difference of 0.080%).
| Demographics | Rating | Rank | Average Family Size |
| Immigrants | Eastern Africa | 30.1 /100 | #192 | Fair 3.22 |
| Immigrants | Israel | 29.3 /100 | #193 | Fair 3.22 |
| Immigrants | Sudan | 29.1 /100 | #194 | Fair 3.22 |
| Choctaw | 28.3 /100 | #195 | Fair 3.21 |
| Senegalese | 28.2 /100 | #196 | Fair 3.21 |
| Kenyans | 28.0 /100 | #197 | Fair 3.21 |
| Immigrants | Azores | 21.7 /100 | #198 | Fair 3.21 |
| Hmong | 20.7 /100 | #199 | Fair 3.21 |
| Immigrants | Kenya | 19.2 /100 | #200 | Poor 3.21 |
| Immigrants | Morocco | 18.5 /100 | #201 | Poor 3.21 |
| Immigrants | India | 18.5 /100 | #202 | Poor 3.21 |
| Immigrants | Nepal | 18.1 /100 | #203 | Poor 3.21 |
| Immigrants | Poland | 16.6 /100 | #204 | Poor 3.20 |
| Paraguayans | 16.3 /100 | #205 | Poor 3.20 |
| Immigrants | Cabo Verde | 16.0 /100 | #206 | Poor 3.20 |