Immigrants vs French Average Family Size
COMPARE
Immigrants
French
Average Family Size
Average Family Size Comparison
Immigrants
French
3.33
AVERAGE FAMILY SIZE
99.9/ 100
METRIC RATING
69th/ 347
METRIC RANK
3.10
AVERAGE FAMILY SIZE
0.0/ 100
METRIC RATING
338th/ 347
METRIC RANK
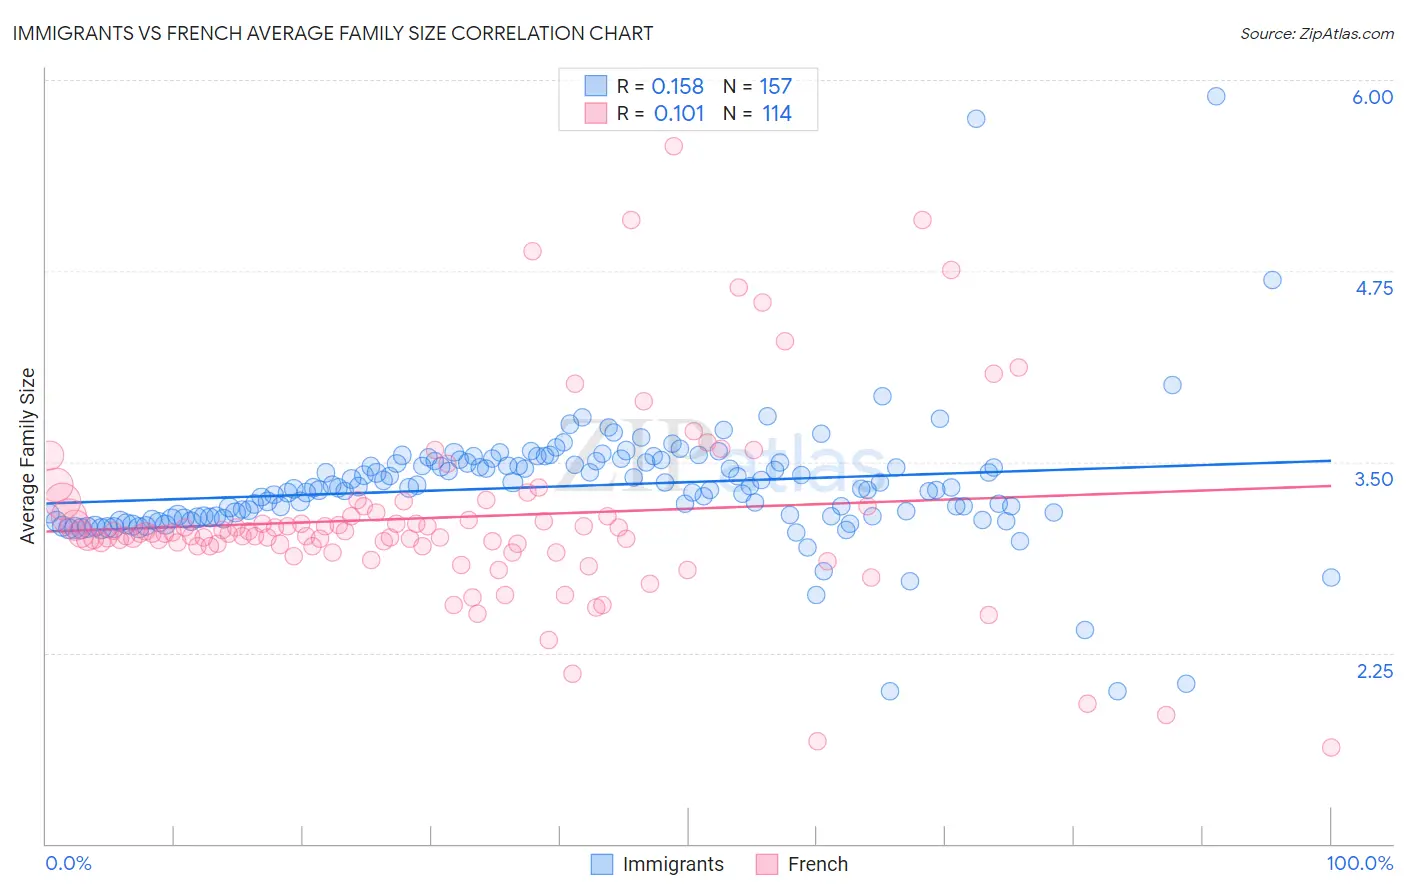
Immigrants vs French Average Family Size Correlation Chart
The statistical analysis conducted on geographies consisting of 577,097,372 people shows a poor positive correlation between the proportion of Immigrants and average family size in the United States with a correlation coefficient (R) of 0.158 and weighted average of 3.33. Similarly, the statistical analysis conducted on geographies consisting of 571,815,188 people shows a poor positive correlation between the proportion of French and average family size in the United States with a correlation coefficient (R) of 0.101 and weighted average of 3.10, a difference of 7.5%.
Average Family Size Correlation Summary
| Measurement | Immigrants | French |
| Minimum | 2.00 | 1.63 |
| Maximum | 5.89 | 5.57 |
| Range | 3.89 | 3.94 |
| Mean | 3.34 | 3.14 |
| Median | 3.33 | 3.03 |
| Interquartile 25% (IQ1) | 3.14 | 2.95 |
| Interquartile 75% (IQ3) | 3.49 | 3.17 |
| Interquartile Range (IQR) | 0.35 | 0.22 |
| Standard Deviation (Sample) | 0.42 | 0.62 |
| Standard Deviation (Population) | 0.42 | 0.62 |
Similar Demographics by Average Family Size
Demographics Similar to Immigrants by Average Family Size
In terms of average family size, the demographic groups most similar to Immigrants are Immigrants from Cambodia (3.33, a difference of 0.030%), Immigrants from Trinidad and Tobago (3.33, a difference of 0.050%), Immigrants from West Indies (3.33, a difference of 0.060%), Immigrants from Jamaica (3.33, a difference of 0.11%), and Immigrants from Caribbean (3.33, a difference of 0.13%).
| Demographics | Rating | Rank | Average Family Size |
| Immigrants | Grenada | 100.0 /100 | #62 | Exceptional 3.34 |
| Chinese | 100.0 /100 | #63 | Exceptional 3.34 |
| Dominicans | 99.9 /100 | #64 | Exceptional 3.34 |
| Immigrants | Laos | 99.9 /100 | #65 | Exceptional 3.34 |
| Immigrants | St. Vincent and the Grenadines | 99.9 /100 | #66 | Exceptional 3.34 |
| Immigrants | Jamaica | 99.9 /100 | #67 | Exceptional 3.33 |
| Immigrants | Cambodia | 99.9 /100 | #68 | Exceptional 3.33 |
| Immigrants | Immigrants | 99.9 /100 | #69 | Exceptional 3.33 |
| Immigrants | Trinidad and Tobago | 99.9 /100 | #70 | Exceptional 3.33 |
| Immigrants | West Indies | 99.9 /100 | #71 | Exceptional 3.33 |
| Immigrants | Caribbean | 99.9 /100 | #72 | Exceptional 3.33 |
| Yaqui | 99.9 /100 | #73 | Exceptional 3.32 |
| Immigrants | Sierra Leone | 99.9 /100 | #74 | Exceptional 3.32 |
| Immigrants | Barbados | 99.8 /100 | #75 | Exceptional 3.32 |
| Trinidadians and Tobagonians | 99.8 /100 | #76 | Exceptional 3.32 |
Demographics Similar to French by Average Family Size
In terms of average family size, the demographic groups most similar to French are Croatian (3.10, a difference of 0.010%), Swedish (3.10, a difference of 0.020%), Irish (3.10, a difference of 0.060%), Luxembourger (3.10, a difference of 0.12%), and Estonian (3.10, a difference of 0.15%).
| Demographics | Rating | Rank | Average Family Size |
| Scotch-Irish | 0.0 /100 | #331 | Tragic 3.11 |
| Scottish | 0.0 /100 | #332 | Tragic 3.11 |
| Estonians | 0.0 /100 | #333 | Tragic 3.10 |
| Lithuanians | 0.0 /100 | #334 | Tragic 3.10 |
| Luxembourgers | 0.0 /100 | #335 | Tragic 3.10 |
| Irish | 0.0 /100 | #336 | Tragic 3.10 |
| Swedes | 0.0 /100 | #337 | Tragic 3.10 |
| French | 0.0 /100 | #338 | Tragic 3.10 |
| Croatians | 0.0 /100 | #339 | Tragic 3.10 |
| Finns | 0.0 /100 | #340 | Tragic 3.09 |
| Poles | 0.0 /100 | #341 | Tragic 3.09 |
| Germans | 0.0 /100 | #342 | Tragic 3.09 |
| Norwegians | 0.0 /100 | #343 | Tragic 3.08 |
| French Canadians | 0.0 /100 | #344 | Tragic 3.07 |
| Slovenes | 0.0 /100 | #345 | Tragic 3.07 |