Immigrants from Fiji vs French Average Family Size
COMPARE
Immigrants from Fiji
French
Average Family Size
Average Family Size Comparison
Immigrants from Fiji
French
3.45
AVERAGE FAMILY SIZE
100.0/ 100
METRIC RATING
23rd/ 347
METRIC RANK
3.10
AVERAGE FAMILY SIZE
0.0/ 100
METRIC RATING
338th/ 347
METRIC RANK
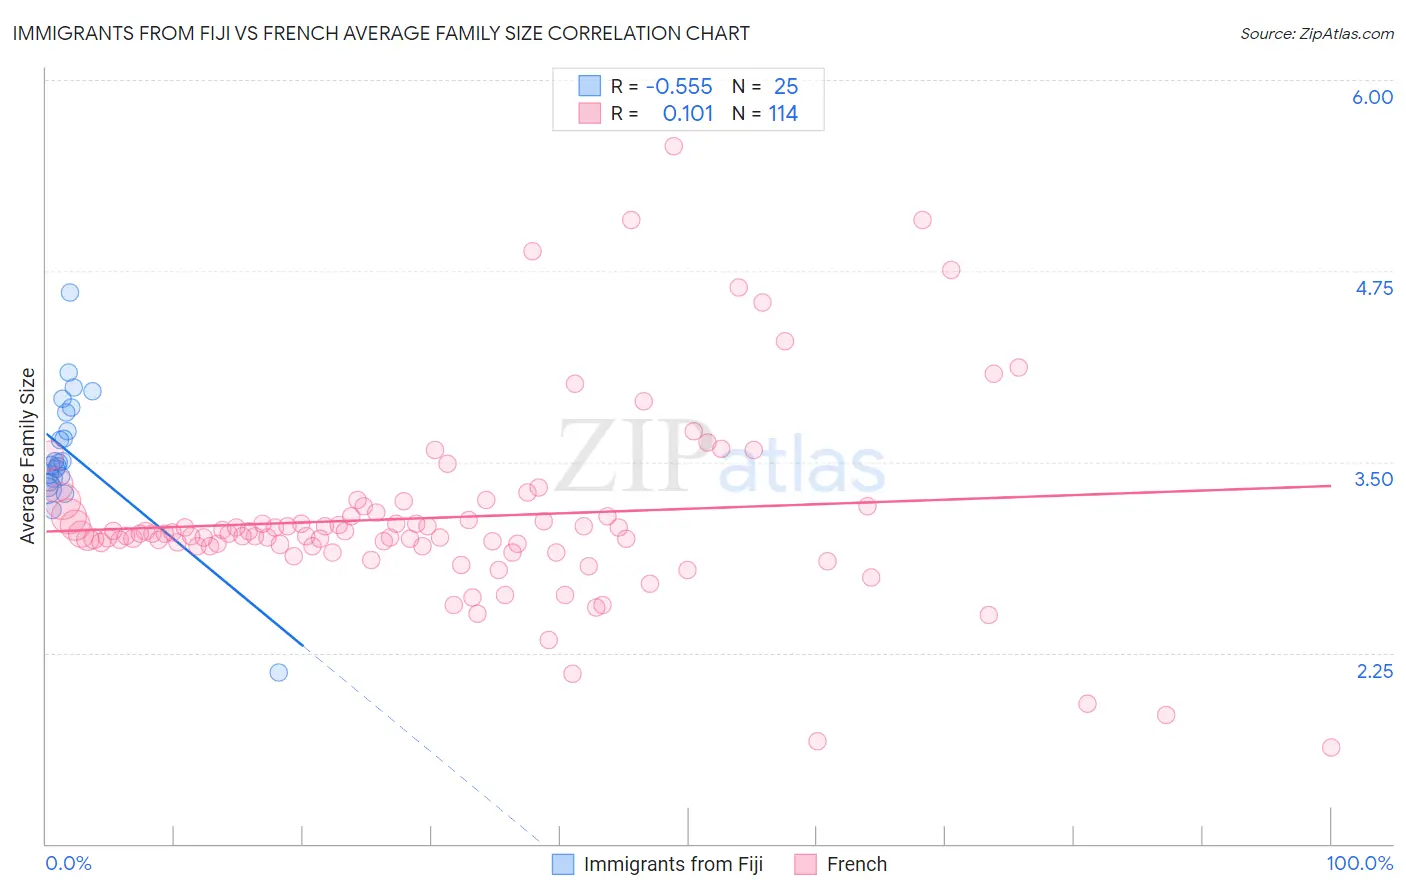
Immigrants from Fiji vs French Average Family Size Correlation Chart
The statistical analysis conducted on geographies consisting of 93,754,900 people shows a substantial negative correlation between the proportion of Immigrants from Fiji and average family size in the United States with a correlation coefficient (R) of -0.555 and weighted average of 3.45. Similarly, the statistical analysis conducted on geographies consisting of 571,815,188 people shows a poor positive correlation between the proportion of French and average family size in the United States with a correlation coefficient (R) of 0.101 and weighted average of 3.10, a difference of 11.4%.
Average Family Size Correlation Summary
| Measurement | Immigrants from Fiji | French |
| Minimum | 2.12 | 1.63 |
| Maximum | 4.61 | 5.57 |
| Range | 2.49 | 3.94 |
| Mean | 3.56 | 3.14 |
| Median | 3.50 | 3.03 |
| Interquartile 25% (IQ1) | 3.38 | 2.95 |
| Interquartile 75% (IQ3) | 3.84 | 3.17 |
| Interquartile Range (IQR) | 0.46 | 0.22 |
| Standard Deviation (Sample) | 0.44 | 0.62 |
| Standard Deviation (Population) | 0.43 | 0.62 |
Similar Demographics by Average Family Size
Demographics Similar to Immigrants from Fiji by Average Family Size
In terms of average family size, the demographic groups most similar to Immigrants from Fiji are Native/Alaskan (3.45, a difference of 0.12%), Yakama (3.45, a difference of 0.23%), Apache (3.46, a difference of 0.29%), Yuman (3.47, a difference of 0.35%), and Cheyenne (3.47, a difference of 0.60%).
| Demographics | Rating | Rank | Average Family Size |
| Ute | 100.0 /100 | #16 | Exceptional 3.49 |
| Immigrants | El Salvador | 100.0 /100 | #17 | Exceptional 3.49 |
| Salvadorans | 100.0 /100 | #18 | Exceptional 3.48 |
| Mexicans | 100.0 /100 | #19 | Exceptional 3.48 |
| Cheyenne | 100.0 /100 | #20 | Exceptional 3.47 |
| Yuman | 100.0 /100 | #21 | Exceptional 3.47 |
| Apache | 100.0 /100 | #22 | Exceptional 3.46 |
| Immigrants | Fiji | 100.0 /100 | #23 | Exceptional 3.45 |
| Natives/Alaskans | 100.0 /100 | #24 | Exceptional 3.45 |
| Yakama | 100.0 /100 | #25 | Exceptional 3.45 |
| Native Hawaiians | 100.0 /100 | #26 | Exceptional 3.43 |
| Mexican American Indians | 100.0 /100 | #27 | Exceptional 3.43 |
| Immigrants | Latin America | 100.0 /100 | #28 | Exceptional 3.42 |
| Nepalese | 100.0 /100 | #29 | Exceptional 3.42 |
| Samoans | 100.0 /100 | #30 | Exceptional 3.42 |
Demographics Similar to French by Average Family Size
In terms of average family size, the demographic groups most similar to French are Croatian (3.10, a difference of 0.010%), Swedish (3.10, a difference of 0.020%), Irish (3.10, a difference of 0.060%), Luxembourger (3.10, a difference of 0.12%), and Estonian (3.10, a difference of 0.15%).
| Demographics | Rating | Rank | Average Family Size |
| Scotch-Irish | 0.0 /100 | #331 | Tragic 3.11 |
| Scottish | 0.0 /100 | #332 | Tragic 3.11 |
| Estonians | 0.0 /100 | #333 | Tragic 3.10 |
| Lithuanians | 0.0 /100 | #334 | Tragic 3.10 |
| Luxembourgers | 0.0 /100 | #335 | Tragic 3.10 |
| Irish | 0.0 /100 | #336 | Tragic 3.10 |
| Swedes | 0.0 /100 | #337 | Tragic 3.10 |
| French | 0.0 /100 | #338 | Tragic 3.10 |
| Croatians | 0.0 /100 | #339 | Tragic 3.10 |
| Finns | 0.0 /100 | #340 | Tragic 3.09 |
| Poles | 0.0 /100 | #341 | Tragic 3.09 |
| Germans | 0.0 /100 | #342 | Tragic 3.09 |
| Norwegians | 0.0 /100 | #343 | Tragic 3.08 |
| French Canadians | 0.0 /100 | #344 | Tragic 3.07 |
| Slovenes | 0.0 /100 | #345 | Tragic 3.07 |