Scandinavian vs French Hearing Disability
COMPARE
Scandinavian
French
Hearing Disability
Hearing Disability Comparison
Scandinavians
French
3.6%
HEARING DISABILITY
0.0/ 100
METRIC RATING
281st/ 347
METRIC RANK
3.8%
HEARING DISABILITY
0.0/ 100
METRIC RATING
304th/ 347
METRIC RANK
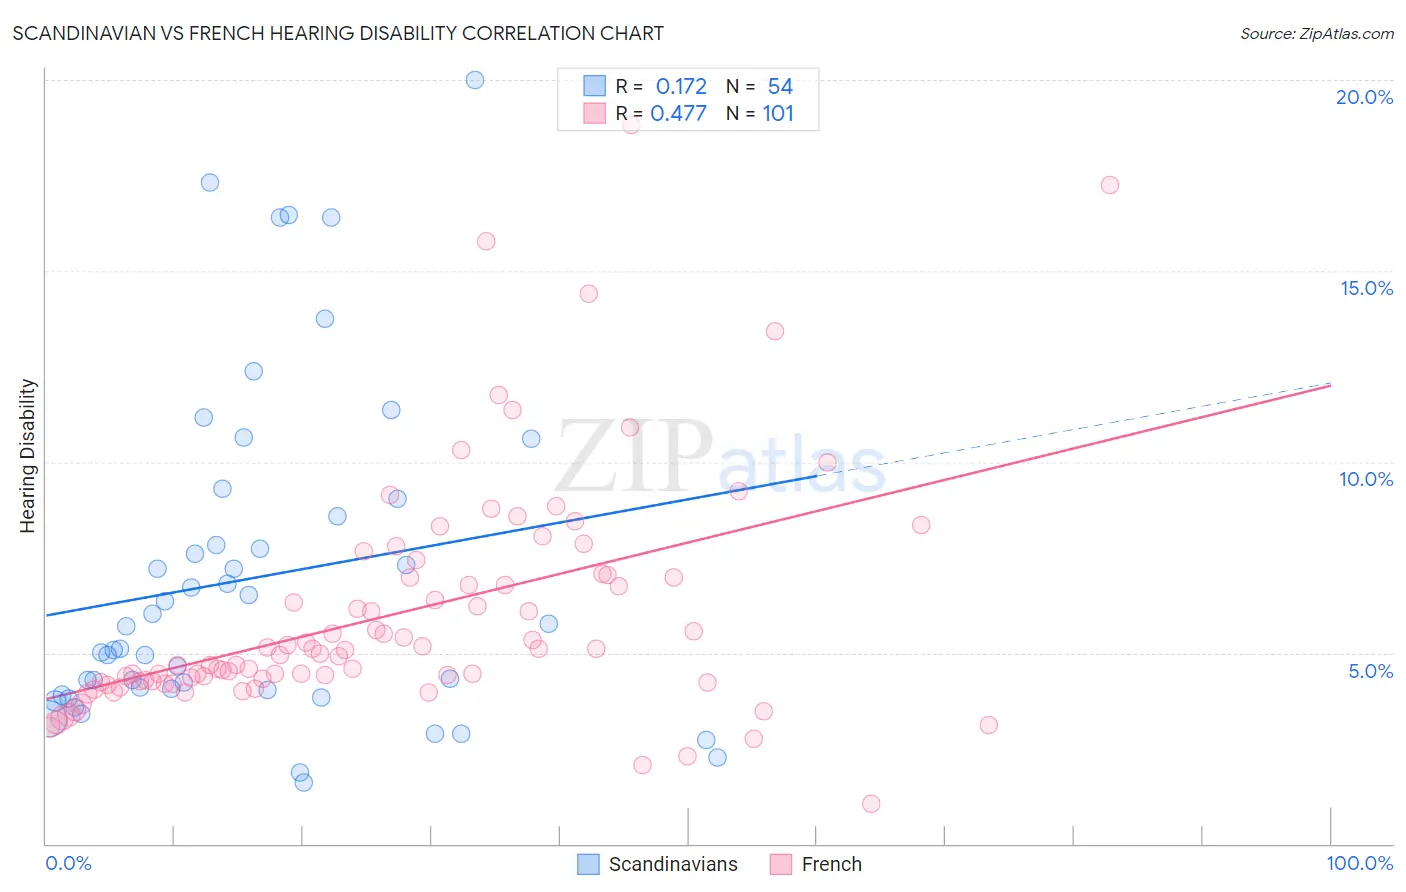
Scandinavian vs French Hearing Disability Correlation Chart
The statistical analysis conducted on geographies consisting of 472,380,661 people shows a poor positive correlation between the proportion of Scandinavians and percentage of population with hearing disability in the United States with a correlation coefficient (R) of 0.172 and weighted average of 3.6%. Similarly, the statistical analysis conducted on geographies consisting of 571,744,911 people shows a moderate positive correlation between the proportion of French and percentage of population with hearing disability in the United States with a correlation coefficient (R) of 0.477 and weighted average of 3.8%, a difference of 4.0%.
Hearing Disability Correlation Summary
| Measurement | Scandinavian | French |
| Minimum | 1.6% | 1.1% |
| Maximum | 20.0% | 18.8% |
| Range | 18.4% | 17.8% |
| Mean | 6.9% | 6.0% |
| Median | 5.4% | 5.0% |
| Interquartile 25% (IQ1) | 4.0% | 4.2% |
| Interquartile 75% (IQ3) | 8.6% | 7.0% |
| Interquartile Range (IQR) | 4.6% | 2.8% |
| Standard Deviation (Sample) | 4.3% | 3.1% |
| Standard Deviation (Population) | 4.3% | 3.1% |
Similar Demographics by Hearing Disability
Demographics Similar to Scandinavians by Hearing Disability
In terms of hearing disability, the demographic groups most similar to Scandinavians are French American Indian (3.6%, a difference of 0.060%), Swedish (3.6%, a difference of 0.090%), Slovak (3.6%, a difference of 0.12%), Blackfeet (3.6%, a difference of 0.34%), and Basque (3.6%, a difference of 0.39%).
| Demographics | Rating | Rank | Hearing Disability |
| Swiss | 0.0 /100 | #274 | Tragic 3.5% |
| Czechoslovakians | 0.0 /100 | #275 | Tragic 3.6% |
| Danes | 0.0 /100 | #276 | Tragic 3.6% |
| Immigrants | Nonimmigrants | 0.0 /100 | #277 | Tragic 3.6% |
| Basques | 0.0 /100 | #278 | Tragic 3.6% |
| Slovaks | 0.0 /100 | #279 | Tragic 3.6% |
| French American Indians | 0.0 /100 | #280 | Tragic 3.6% |
| Scandinavians | 0.0 /100 | #281 | Tragic 3.6% |
| Swedes | 0.0 /100 | #282 | Tragic 3.6% |
| Blackfeet | 0.0 /100 | #283 | Tragic 3.6% |
| Immigrants | Micronesia | 0.0 /100 | #284 | Tragic 3.6% |
| Sioux | 0.0 /100 | #285 | Tragic 3.6% |
| Delaware | 0.0 /100 | #286 | Tragic 3.6% |
| Spanish | 0.0 /100 | #287 | Tragic 3.7% |
| Irish | 0.0 /100 | #288 | Tragic 3.7% |
Demographics Similar to French by Hearing Disability
In terms of hearing disability, the demographic groups most similar to French are Menominee (3.7%, a difference of 0.30%), Dutch (3.7%, a difference of 0.36%), Pennsylvania German (3.7%, a difference of 0.47%), Scottish (3.7%, a difference of 0.49%), and German (3.7%, a difference of 0.56%).
| Demographics | Rating | Rank | Hearing Disability |
| Immigrants | Azores | 0.0 /100 | #297 | Tragic 3.7% |
| Celtics | 0.0 /100 | #298 | Tragic 3.7% |
| Germans | 0.0 /100 | #299 | Tragic 3.7% |
| Scottish | 0.0 /100 | #300 | Tragic 3.7% |
| Pennsylvania Germans | 0.0 /100 | #301 | Tragic 3.7% |
| Dutch | 0.0 /100 | #302 | Tragic 3.7% |
| Menominee | 0.0 /100 | #303 | Tragic 3.7% |
| French | 0.0 /100 | #304 | Tragic 3.8% |
| English | 0.0 /100 | #305 | Tragic 3.8% |
| Marshallese | 0.0 /100 | #306 | Tragic 3.8% |
| French Canadians | 0.0 /100 | #307 | Tragic 3.8% |
| Ottawa | 0.0 /100 | #308 | Tragic 3.8% |
| Scotch-Irish | 0.0 /100 | #309 | Tragic 3.8% |
| Cree | 0.0 /100 | #310 | Tragic 3.8% |
| Americans | 0.0 /100 | #311 | Tragic 3.9% |