Immigrants from Kazakhstan vs French Average Family Size
COMPARE
Immigrants from Kazakhstan
French
Average Family Size
Average Family Size Comparison
Immigrants from Kazakhstan
French
3.17
AVERAGE FAMILY SIZE
1.5/ 100
METRIC RATING
256th/ 347
METRIC RANK
3.10
AVERAGE FAMILY SIZE
0.0/ 100
METRIC RATING
338th/ 347
METRIC RANK
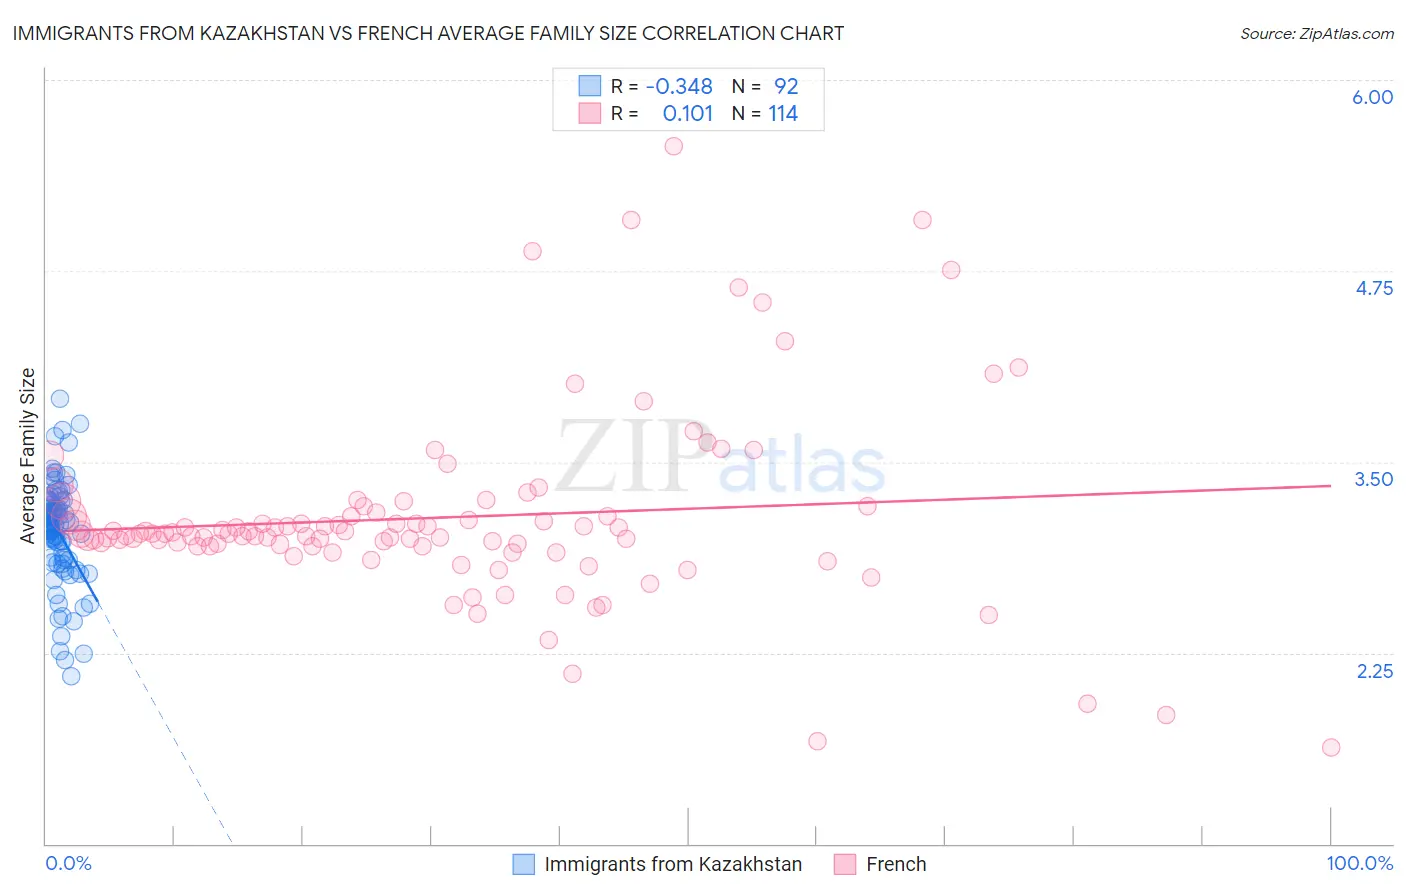
Immigrants from Kazakhstan vs French Average Family Size Correlation Chart
The statistical analysis conducted on geographies consisting of 124,429,118 people shows a mild negative correlation between the proportion of Immigrants from Kazakhstan and average family size in the United States with a correlation coefficient (R) of -0.348 and weighted average of 3.17. Similarly, the statistical analysis conducted on geographies consisting of 571,815,188 people shows a poor positive correlation between the proportion of French and average family size in the United States with a correlation coefficient (R) of 0.101 and weighted average of 3.10, a difference of 2.2%.
Average Family Size Correlation Summary
| Measurement | Immigrants from Kazakhstan | French |
| Minimum | 2.10 | 1.63 |
| Maximum | 3.91 | 5.57 |
| Range | 1.81 | 3.94 |
| Mean | 3.04 | 3.14 |
| Median | 3.09 | 3.03 |
| Interquartile 25% (IQ1) | 2.86 | 2.95 |
| Interquartile 75% (IQ3) | 3.23 | 3.17 |
| Interquartile Range (IQR) | 0.37 | 0.22 |
| Standard Deviation (Sample) | 0.34 | 0.62 |
| Standard Deviation (Population) | 0.33 | 0.62 |
Similar Demographics by Average Family Size
Demographics Similar to Immigrants from Kazakhstan by Average Family Size
In terms of average family size, the demographic groups most similar to Immigrants from Kazakhstan are Albanian (3.17, a difference of 0.020%), Cape Verdean (3.17, a difference of 0.030%), South African (3.17, a difference of 0.040%), Immigrants from Hungary (3.17, a difference of 0.040%), and Immigrants from Saudi Arabia (3.17, a difference of 0.050%).
| Demographics | Rating | Rank | Average Family Size |
| Immigrants | Eastern Europe | 2.1 /100 | #249 | Tragic 3.17 |
| Puget Sound Salish | 1.9 /100 | #250 | Tragic 3.17 |
| Immigrants | Spain | 1.8 /100 | #251 | Tragic 3.17 |
| Immigrants | Saudi Arabia | 1.7 /100 | #252 | Tragic 3.17 |
| South Africans | 1.7 /100 | #253 | Tragic 3.17 |
| Immigrants | Hungary | 1.7 /100 | #254 | Tragic 3.17 |
| Cape Verdeans | 1.6 /100 | #255 | Tragic 3.17 |
| Immigrants | Kazakhstan | 1.5 /100 | #256 | Tragic 3.17 |
| Albanians | 1.5 /100 | #257 | Tragic 3.17 |
| Turks | 1.3 /100 | #258 | Tragic 3.16 |
| Potawatomi | 1.3 /100 | #259 | Tragic 3.16 |
| Immigrants | Albania | 1.3 /100 | #260 | Tragic 3.16 |
| Immigrants | North Macedonia | 1.3 /100 | #261 | Tragic 3.16 |
| Immigrants | Russia | 1.3 /100 | #262 | Tragic 3.16 |
| Immigrants | Bulgaria | 1.0 /100 | #263 | Tragic 3.16 |
Demographics Similar to French by Average Family Size
In terms of average family size, the demographic groups most similar to French are Croatian (3.10, a difference of 0.010%), Swedish (3.10, a difference of 0.020%), Irish (3.10, a difference of 0.060%), Luxembourger (3.10, a difference of 0.12%), and Estonian (3.10, a difference of 0.15%).
| Demographics | Rating | Rank | Average Family Size |
| Scotch-Irish | 0.0 /100 | #331 | Tragic 3.11 |
| Scottish | 0.0 /100 | #332 | Tragic 3.11 |
| Estonians | 0.0 /100 | #333 | Tragic 3.10 |
| Lithuanians | 0.0 /100 | #334 | Tragic 3.10 |
| Luxembourgers | 0.0 /100 | #335 | Tragic 3.10 |
| Irish | 0.0 /100 | #336 | Tragic 3.10 |
| Swedes | 0.0 /100 | #337 | Tragic 3.10 |
| French | 0.0 /100 | #338 | Tragic 3.10 |
| Croatians | 0.0 /100 | #339 | Tragic 3.10 |
| Finns | 0.0 /100 | #340 | Tragic 3.09 |
| Poles | 0.0 /100 | #341 | Tragic 3.09 |
| Germans | 0.0 /100 | #342 | Tragic 3.09 |
| Norwegians | 0.0 /100 | #343 | Tragic 3.08 |
| French Canadians | 0.0 /100 | #344 | Tragic 3.07 |
| Slovenes | 0.0 /100 | #345 | Tragic 3.07 |