Samoan vs Immigrants from Colombia Currently Married
COMPARE
Samoan
Immigrants from Colombia
Currently Married
Currently Married Comparison
Samoans
Immigrants from Colombia
46.8%
CURRENTLY MARRIED
59.8/ 100
METRIC RATING
165th/ 347
METRIC RANK
46.1%
CURRENTLY MARRIED
21.0/ 100
METRIC RATING
198th/ 347
METRIC RANK
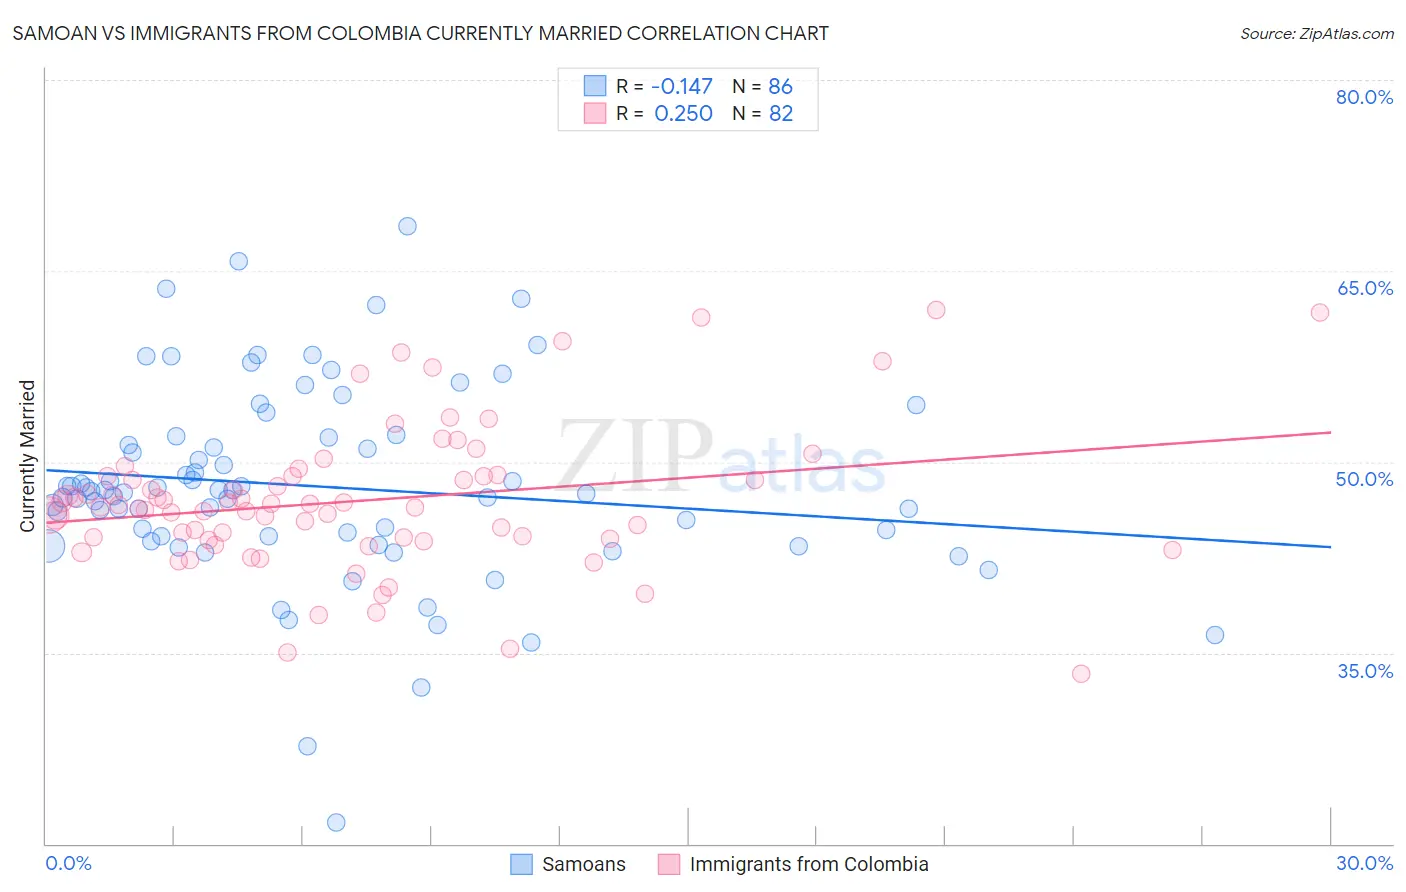
Samoan vs Immigrants from Colombia Currently Married Correlation Chart
The statistical analysis conducted on geographies consisting of 225,188,155 people shows a poor negative correlation between the proportion of Samoans and percentage of population currently married in the United States with a correlation coefficient (R) of -0.147 and weighted average of 46.8%. Similarly, the statistical analysis conducted on geographies consisting of 378,670,909 people shows a weak positive correlation between the proportion of Immigrants from Colombia and percentage of population currently married in the United States with a correlation coefficient (R) of 0.250 and weighted average of 46.1%, a difference of 1.6%.
Currently Married Correlation Summary
| Measurement | Samoan | Immigrants from Colombia |
| Minimum | 21.7% | 33.3% |
| Maximum | 68.5% | 61.9% |
| Range | 46.8% | 28.6% |
| Mean | 48.1% | 47.0% |
| Median | 47.6% | 46.5% |
| Interquartile 25% (IQ1) | 44.1% | 44.0% |
| Interquartile 75% (IQ3) | 51.9% | 48.9% |
| Interquartile Range (IQR) | 7.8% | 4.9% |
| Standard Deviation (Sample) | 7.8% | 5.6% |
| Standard Deviation (Population) | 7.7% | 5.6% |
Similar Demographics by Currently Married
Demographics Similar to Samoans by Currently Married
In terms of currently married, the demographic groups most similar to Samoans are Immigrants from Syria (46.8%, a difference of 0.020%), Spaniard (46.8%, a difference of 0.040%), Immigrants from Afghanistan (46.8%, a difference of 0.060%), Armenian (46.8%, a difference of 0.060%), and Immigrants from Latvia (46.7%, a difference of 0.11%).
| Demographics | Rating | Rank | Currently Married |
| Cherokee | 66.8 /100 | #158 | Good 46.9% |
| Iraqis | 66.4 /100 | #159 | Good 46.9% |
| Immigrants | Uzbekistan | 66.0 /100 | #160 | Good 46.9% |
| Immigrants | Southern Europe | 65.9 /100 | #161 | Good 46.9% |
| Immigrants | Nonimmigrants | 65.4 /100 | #162 | Good 46.9% |
| Delaware | 64.7 /100 | #163 | Good 46.9% |
| Immigrants | Western Asia | 64.2 /100 | #164 | Good 46.9% |
| Samoans | 59.8 /100 | #165 | Average 46.8% |
| Immigrants | Syria | 59.3 /100 | #166 | Average 46.8% |
| Spaniards | 58.8 /100 | #167 | Average 46.8% |
| Immigrants | Afghanistan | 58.2 /100 | #168 | Average 46.8% |
| Armenians | 58.2 /100 | #169 | Average 46.8% |
| Immigrants | Latvia | 56.7 /100 | #170 | Average 46.7% |
| Immigrants | Zimbabwe | 52.4 /100 | #171 | Average 46.7% |
| Aleuts | 52.0 /100 | #172 | Average 46.7% |
Demographics Similar to Immigrants from Colombia by Currently Married
In terms of currently married, the demographic groups most similar to Immigrants from Colombia are Immigrants from Kuwait (46.1%, a difference of 0.040%), Immigrants from Bosnia and Herzegovina (46.1%, a difference of 0.070%), Immigrants from Costa Rica (46.0%, a difference of 0.080%), Immigrants from Nepal (46.1%, a difference of 0.14%), and South American (46.1%, a difference of 0.15%).
| Demographics | Rating | Rank | Currently Married |
| Immigrants | France | 27.7 /100 | #191 | Fair 46.2% |
| Soviet Union | 25.7 /100 | #192 | Fair 46.2% |
| Immigrants | Fiji | 25.0 /100 | #193 | Fair 46.2% |
| South Americans | 23.8 /100 | #194 | Fair 46.1% |
| Immigrants | Nepal | 23.7 /100 | #195 | Fair 46.1% |
| Immigrants | Bosnia and Herzegovina | 22.2 /100 | #196 | Fair 46.1% |
| Immigrants | Kuwait | 21.7 /100 | #197 | Fair 46.1% |
| Immigrants | Colombia | 21.0 /100 | #198 | Fair 46.1% |
| Immigrants | Costa Rica | 19.6 /100 | #199 | Poor 46.0% |
| Creek | 17.2 /100 | #200 | Poor 46.0% |
| Malaysians | 15.3 /100 | #201 | Poor 45.9% |
| Immigrants | Albania | 14.5 /100 | #202 | Poor 45.9% |
| Taiwanese | 11.7 /100 | #203 | Poor 45.8% |
| Immigrants | Spain | 11.6 /100 | #204 | Poor 45.8% |
| South American Indians | 11.5 /100 | #205 | Poor 45.8% |