Samoan vs Macedonian Currently Married
COMPARE
Samoan
Macedonian
Currently Married
Currently Married Comparison
Samoans
Macedonians
46.8%
CURRENTLY MARRIED
59.8/ 100
METRIC RATING
165th/ 347
METRIC RANK
48.3%
CURRENTLY MARRIED
97.9/ 100
METRIC RATING
71st/ 347
METRIC RANK
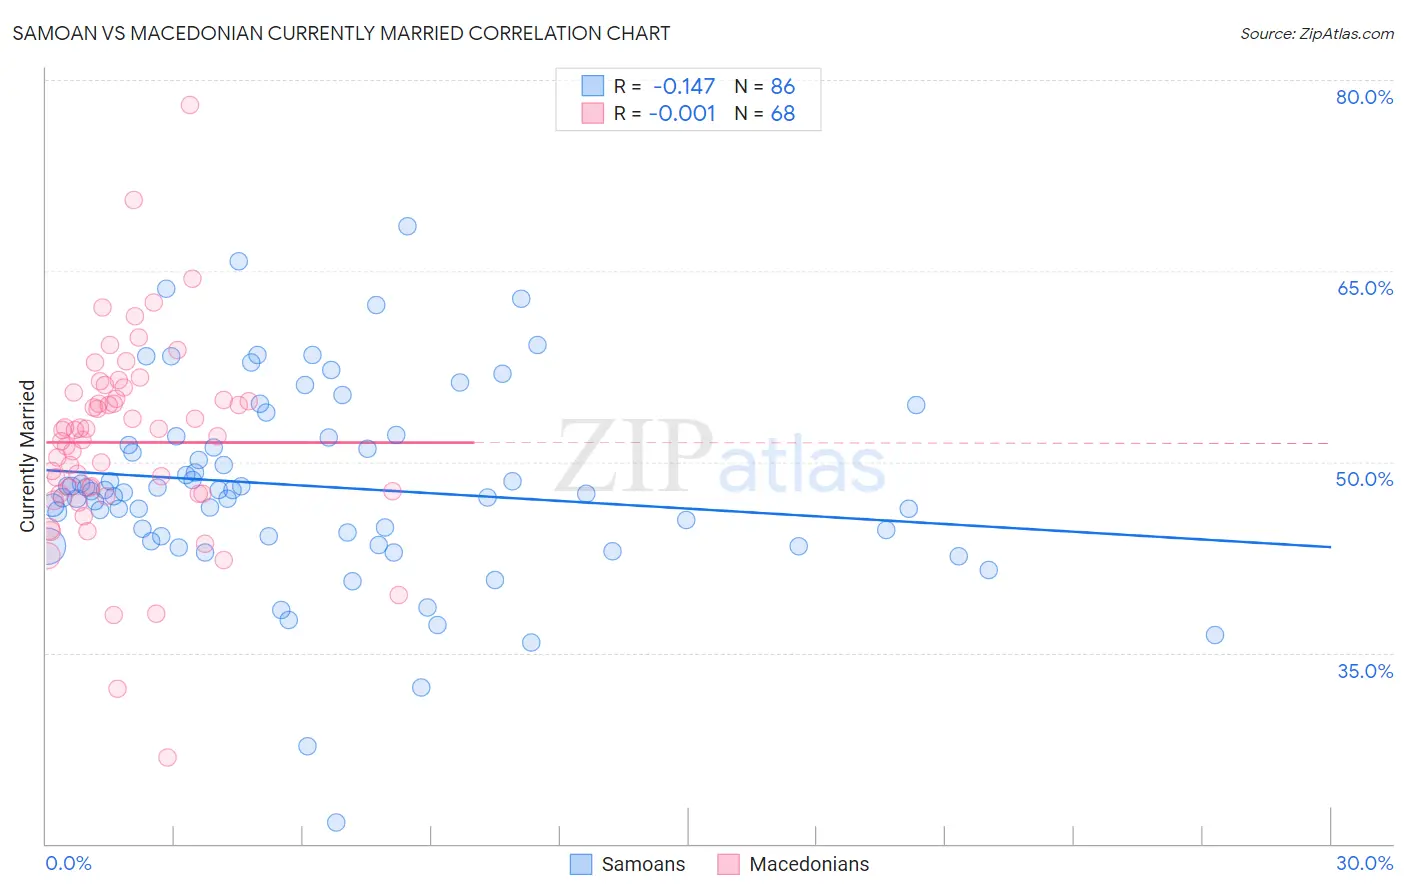
Samoan vs Macedonian Currently Married Correlation Chart
The statistical analysis conducted on geographies consisting of 225,188,155 people shows a poor negative correlation between the proportion of Samoans and percentage of population currently married in the United States with a correlation coefficient (R) of -0.147 and weighted average of 46.8%. Similarly, the statistical analysis conducted on geographies consisting of 132,654,492 people shows no correlation between the proportion of Macedonians and percentage of population currently married in the United States with a correlation coefficient (R) of -0.001 and weighted average of 48.3%, a difference of 3.2%.
Currently Married Correlation Summary
| Measurement | Samoan | Macedonian |
| Minimum | 21.7% | 26.8% |
| Maximum | 68.5% | 78.0% |
| Range | 46.8% | 51.2% |
| Mean | 48.1% | 51.5% |
| Median | 47.6% | 52.3% |
| Interquartile 25% (IQ1) | 44.1% | 47.5% |
| Interquartile 75% (IQ3) | 51.9% | 55.2% |
| Interquartile Range (IQR) | 7.8% | 7.7% |
| Standard Deviation (Sample) | 7.8% | 7.9% |
| Standard Deviation (Population) | 7.7% | 7.8% |
Similar Demographics by Currently Married
Demographics Similar to Samoans by Currently Married
In terms of currently married, the demographic groups most similar to Samoans are Immigrants from Syria (46.8%, a difference of 0.020%), Spaniard (46.8%, a difference of 0.040%), Immigrants from Afghanistan (46.8%, a difference of 0.060%), Armenian (46.8%, a difference of 0.060%), and Immigrants from Latvia (46.7%, a difference of 0.11%).
| Demographics | Rating | Rank | Currently Married |
| Cherokee | 66.8 /100 | #158 | Good 46.9% |
| Iraqis | 66.4 /100 | #159 | Good 46.9% |
| Immigrants | Uzbekistan | 66.0 /100 | #160 | Good 46.9% |
| Immigrants | Southern Europe | 65.9 /100 | #161 | Good 46.9% |
| Immigrants | Nonimmigrants | 65.4 /100 | #162 | Good 46.9% |
| Delaware | 64.7 /100 | #163 | Good 46.9% |
| Immigrants | Western Asia | 64.2 /100 | #164 | Good 46.9% |
| Samoans | 59.8 /100 | #165 | Average 46.8% |
| Immigrants | Syria | 59.3 /100 | #166 | Average 46.8% |
| Spaniards | 58.8 /100 | #167 | Average 46.8% |
| Immigrants | Afghanistan | 58.2 /100 | #168 | Average 46.8% |
| Armenians | 58.2 /100 | #169 | Average 46.8% |
| Immigrants | Latvia | 56.7 /100 | #170 | Average 46.7% |
| Immigrants | Zimbabwe | 52.4 /100 | #171 | Average 46.7% |
| Aleuts | 52.0 /100 | #172 | Average 46.7% |
Demographics Similar to Macedonians by Currently Married
In terms of currently married, the demographic groups most similar to Macedonians are Immigrants from Asia (48.3%, a difference of 0.010%), Canadian (48.3%, a difference of 0.090%), Immigrants from England (48.3%, a difference of 0.11%), Slovak (48.3%, a difference of 0.12%), and Tongan (48.3%, a difference of 0.13%).
| Demographics | Rating | Rank | Currently Married |
| Immigrants | Czechoslovakia | 98.3 /100 | #64 | Exceptional 48.4% |
| Ukrainians | 98.3 /100 | #65 | Exceptional 48.4% |
| Tongans | 98.2 /100 | #66 | Exceptional 48.3% |
| Slovaks | 98.2 /100 | #67 | Exceptional 48.3% |
| Immigrants | England | 98.2 /100 | #68 | Exceptional 48.3% |
| Canadians | 98.1 /100 | #69 | Exceptional 48.3% |
| Immigrants | Asia | 97.9 /100 | #70 | Exceptional 48.3% |
| Macedonians | 97.9 /100 | #71 | Exceptional 48.3% |
| Immigrants | Lebanon | 97.6 /100 | #72 | Exceptional 48.2% |
| Immigrants | Eastern Asia | 97.5 /100 | #73 | Exceptional 48.2% |
| Estonians | 97.4 /100 | #74 | Exceptional 48.2% |
| Immigrants | Belarus | 97.2 /100 | #75 | Exceptional 48.1% |
| Basques | 97.2 /100 | #76 | Exceptional 48.1% |
| Slovenes | 97.1 /100 | #77 | Exceptional 48.1% |
| Immigrants | Belgium | 97.1 /100 | #78 | Exceptional 48.1% |