South American vs Hispanic or Latino Currently Married
COMPARE
South American
Hispanic or Latino
Currently Married
Currently Married Comparison
South Americans
Hispanics or Latinos
46.1%
CURRENTLY MARRIED
23.8/ 100
METRIC RATING
194th/ 347
METRIC RANK
44.1%
CURRENTLY MARRIED
0.3/ 100
METRIC RATING
252nd/ 347
METRIC RANK
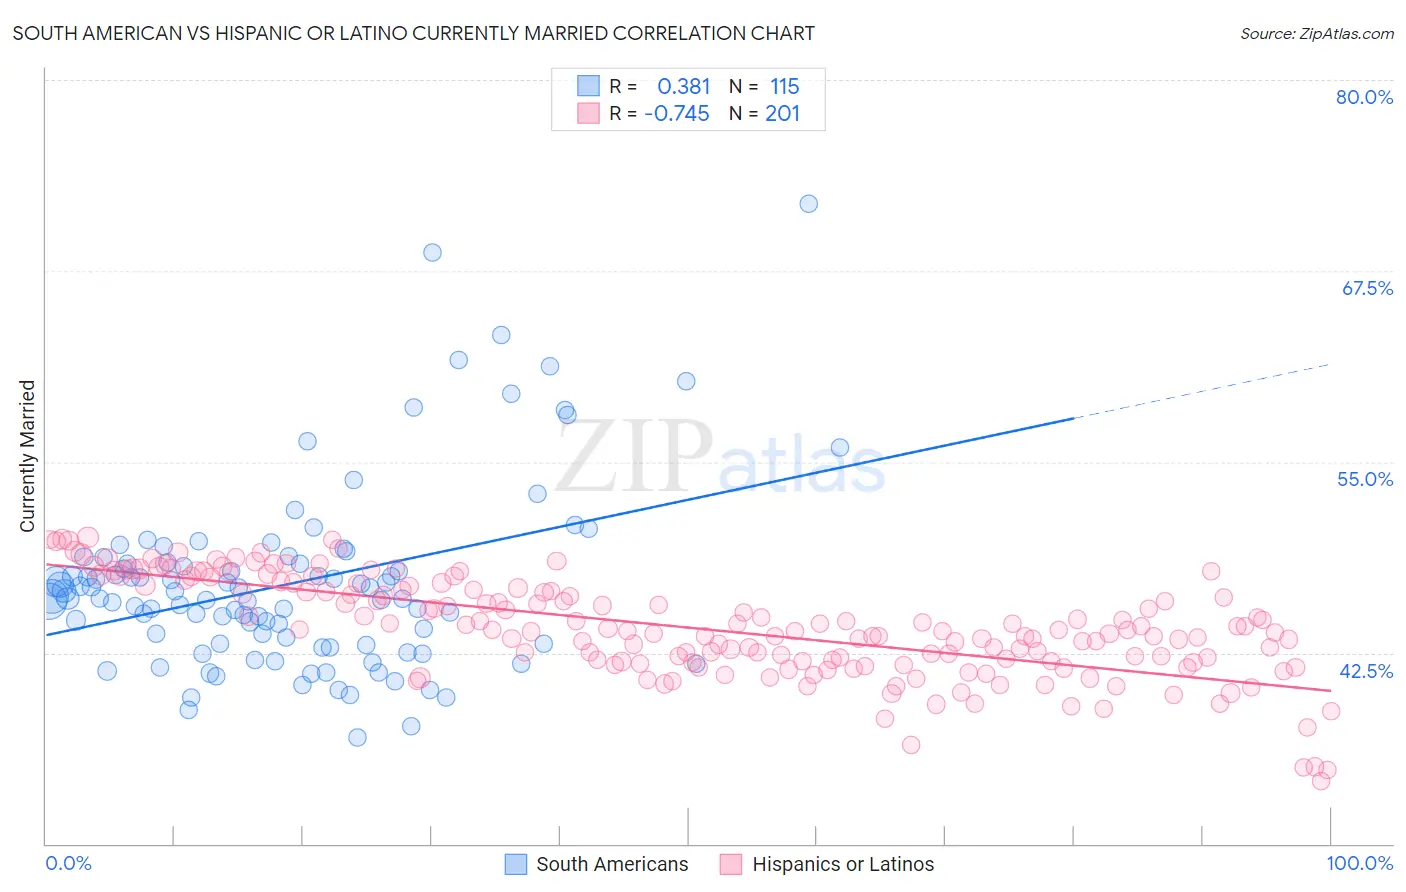
South American vs Hispanic or Latino Currently Married Correlation Chart
The statistical analysis conducted on geographies consisting of 494,081,354 people shows a mild positive correlation between the proportion of South Americans and percentage of population currently married in the United States with a correlation coefficient (R) of 0.381 and weighted average of 46.1%. Similarly, the statistical analysis conducted on geographies consisting of 578,461,581 people shows a strong negative correlation between the proportion of Hispanics or Latinos and percentage of population currently married in the United States with a correlation coefficient (R) of -0.745 and weighted average of 44.1%, a difference of 4.5%.
Currently Married Correlation Summary
| Measurement | South American | Hispanic or Latino |
| Minimum | 37.0% | 34.1% |
| Maximum | 71.9% | 50.1% |
| Range | 34.9% | 16.0% |
| Mean | 47.0% | 44.1% |
| Median | 46.1% | 44.0% |
| Interquartile 25% (IQ1) | 43.1% | 42.0% |
| Interquartile 75% (IQ3) | 48.4% | 46.8% |
| Interquartile Range (IQR) | 5.3% | 4.8% |
| Standard Deviation (Sample) | 6.0% | 3.2% |
| Standard Deviation (Population) | 6.0% | 3.2% |
Similar Demographics by Currently Married
Demographics Similar to South Americans by Currently Married
In terms of currently married, the demographic groups most similar to South Americans are Immigrants from Nepal (46.1%, a difference of 0.010%), Immigrants from Fiji (46.2%, a difference of 0.060%), Immigrants from Bosnia and Herzegovina (46.1%, a difference of 0.080%), Soviet Union (46.2%, a difference of 0.10%), and Immigrants from Kuwait (46.1%, a difference of 0.11%).
| Demographics | Rating | Rank | Currently Married |
| Immigrants | Peru | 35.3 /100 | #187 | Fair 46.4% |
| Colombians | 31.8 /100 | #188 | Fair 46.3% |
| Fijians | 30.3 /100 | #189 | Fair 46.3% |
| Choctaw | 29.1 /100 | #190 | Fair 46.3% |
| Immigrants | France | 27.7 /100 | #191 | Fair 46.2% |
| Soviet Union | 25.7 /100 | #192 | Fair 46.2% |
| Immigrants | Fiji | 25.0 /100 | #193 | Fair 46.2% |
| South Americans | 23.8 /100 | #194 | Fair 46.1% |
| Immigrants | Nepal | 23.7 /100 | #195 | Fair 46.1% |
| Immigrants | Bosnia and Herzegovina | 22.2 /100 | #196 | Fair 46.1% |
| Immigrants | Kuwait | 21.7 /100 | #197 | Fair 46.1% |
| Immigrants | Colombia | 21.0 /100 | #198 | Fair 46.1% |
| Immigrants | Costa Rica | 19.6 /100 | #199 | Poor 46.0% |
| Creek | 17.2 /100 | #200 | Poor 46.0% |
| Malaysians | 15.3 /100 | #201 | Poor 45.9% |
Demographics Similar to Hispanics or Latinos by Currently Married
In terms of currently married, the demographic groups most similar to Hispanics or Latinos are Blackfeet (44.2%, a difference of 0.020%), Immigrants from Central America (44.1%, a difference of 0.030%), Immigrants from Eastern Africa (44.2%, a difference of 0.080%), Immigrants from Cameroon (44.2%, a difference of 0.11%), and Nicaraguan (44.2%, a difference of 0.12%).
| Demographics | Rating | Rank | Currently Married |
| Immigrants | Armenia | 0.4 /100 | #245 | Tragic 44.3% |
| Immigrants | Burma/Myanmar | 0.4 /100 | #246 | Tragic 44.3% |
| Ugandans | 0.4 /100 | #247 | Tragic 44.2% |
| Nicaraguans | 0.3 /100 | #248 | Tragic 44.2% |
| Immigrants | Cameroon | 0.3 /100 | #249 | Tragic 44.2% |
| Immigrants | Eastern Africa | 0.3 /100 | #250 | Tragic 44.2% |
| Blackfeet | 0.3 /100 | #251 | Tragic 44.2% |
| Hispanics or Latinos | 0.3 /100 | #252 | Tragic 44.1% |
| Immigrants | Central America | 0.3 /100 | #253 | Tragic 44.1% |
| Vietnamese | 0.2 /100 | #254 | Tragic 44.0% |
| Yakama | 0.2 /100 | #255 | Tragic 44.0% |
| Shoshone | 0.2 /100 | #256 | Tragic 44.0% |
| Immigrants | Africa | 0.2 /100 | #257 | Tragic 43.9% |
| Ute | 0.2 /100 | #258 | Tragic 43.9% |
| Immigrants | Sierra Leone | 0.1 /100 | #259 | Tragic 43.8% |