Menominee vs Hispanic or Latino Currently Married
COMPARE
Menominee
Hispanic or Latino
Currently Married
Currently Married Comparison
Menominee
Hispanics or Latinos
42.3%
CURRENTLY MARRIED
0.0/ 100
METRIC RATING
296th/ 347
METRIC RANK
44.1%
CURRENTLY MARRIED
0.3/ 100
METRIC RATING
252nd/ 347
METRIC RANK
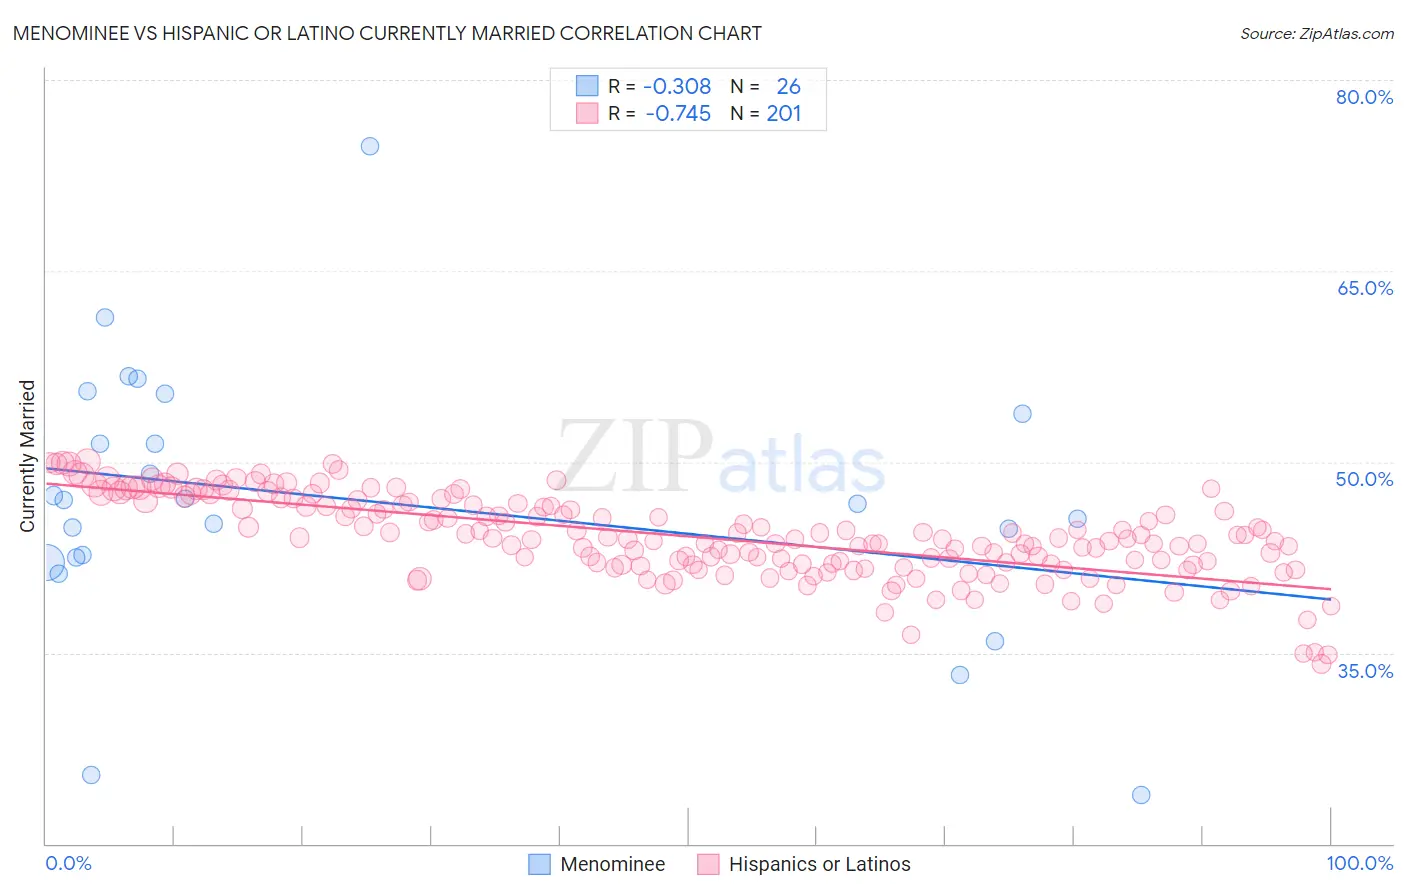
Menominee vs Hispanic or Latino Currently Married Correlation Chart
The statistical analysis conducted on geographies consisting of 45,778,979 people shows a mild negative correlation between the proportion of Menominee and percentage of population currently married in the United States with a correlation coefficient (R) of -0.308 and weighted average of 42.3%. Similarly, the statistical analysis conducted on geographies consisting of 578,461,581 people shows a strong negative correlation between the proportion of Hispanics or Latinos and percentage of population currently married in the United States with a correlation coefficient (R) of -0.745 and weighted average of 44.1%, a difference of 4.4%.
Currently Married Correlation Summary
| Measurement | Menominee | Hispanic or Latino |
| Minimum | 23.8% | 34.1% |
| Maximum | 74.8% | 50.1% |
| Range | 51.0% | 16.0% |
| Mean | 47.0% | 44.1% |
| Median | 46.8% | 44.0% |
| Interquartile 25% (IQ1) | 42.5% | 42.0% |
| Interquartile 75% (IQ3) | 53.8% | 46.8% |
| Interquartile Range (IQR) | 11.3% | 4.8% |
| Standard Deviation (Sample) | 10.6% | 3.2% |
| Standard Deviation (Population) | 10.4% | 3.2% |
Similar Demographics by Currently Married
Demographics Similar to Menominee by Currently Married
In terms of currently married, the demographic groups most similar to Menominee are Cheyenne (42.2%, a difference of 0.11%), Immigrants from Honduras (42.2%, a difference of 0.20%), Immigrants from Western Africa (42.4%, a difference of 0.21%), Liberian (42.2%, a difference of 0.23%), and Belizean (42.2%, a difference of 0.33%).
| Demographics | Rating | Rank | Currently Married |
| Paiute | 0.0 /100 | #289 | Tragic 42.7% |
| Immigrants | Ghana | 0.0 /100 | #290 | Tragic 42.7% |
| Immigrants | Guatemala | 0.0 /100 | #291 | Tragic 42.6% |
| Sub-Saharan Africans | 0.0 /100 | #292 | Tragic 42.6% |
| Yuman | 0.0 /100 | #293 | Tragic 42.6% |
| Hondurans | 0.0 /100 | #294 | Tragic 42.5% |
| Immigrants | Western Africa | 0.0 /100 | #295 | Tragic 42.4% |
| Menominee | 0.0 /100 | #296 | Tragic 42.3% |
| Cheyenne | 0.0 /100 | #297 | Tragic 42.2% |
| Immigrants | Honduras | 0.0 /100 | #298 | Tragic 42.2% |
| Liberians | 0.0 /100 | #299 | Tragic 42.2% |
| Belizeans | 0.0 /100 | #300 | Tragic 42.2% |
| Immigrants | Yemen | 0.0 /100 | #301 | Tragic 42.1% |
| Immigrants | Zaire | 0.0 /100 | #302 | Tragic 42.0% |
| Sioux | 0.0 /100 | #303 | Tragic 41.9% |
Demographics Similar to Hispanics or Latinos by Currently Married
In terms of currently married, the demographic groups most similar to Hispanics or Latinos are Blackfeet (44.2%, a difference of 0.020%), Immigrants from Central America (44.1%, a difference of 0.030%), Immigrants from Eastern Africa (44.2%, a difference of 0.080%), Immigrants from Cameroon (44.2%, a difference of 0.11%), and Nicaraguan (44.2%, a difference of 0.12%).
| Demographics | Rating | Rank | Currently Married |
| Immigrants | Armenia | 0.4 /100 | #245 | Tragic 44.3% |
| Immigrants | Burma/Myanmar | 0.4 /100 | #246 | Tragic 44.3% |
| Ugandans | 0.4 /100 | #247 | Tragic 44.2% |
| Nicaraguans | 0.3 /100 | #248 | Tragic 44.2% |
| Immigrants | Cameroon | 0.3 /100 | #249 | Tragic 44.2% |
| Immigrants | Eastern Africa | 0.3 /100 | #250 | Tragic 44.2% |
| Blackfeet | 0.3 /100 | #251 | Tragic 44.2% |
| Hispanics or Latinos | 0.3 /100 | #252 | Tragic 44.1% |
| Immigrants | Central America | 0.3 /100 | #253 | Tragic 44.1% |
| Vietnamese | 0.2 /100 | #254 | Tragic 44.0% |
| Yakama | 0.2 /100 | #255 | Tragic 44.0% |
| Shoshone | 0.2 /100 | #256 | Tragic 44.0% |
| Immigrants | Africa | 0.2 /100 | #257 | Tragic 43.9% |
| Ute | 0.2 /100 | #258 | Tragic 43.9% |
| Immigrants | Sierra Leone | 0.1 /100 | #259 | Tragic 43.8% |