Samoan vs Nonimmigrants Currently Married
COMPARE
Samoan
Nonimmigrants
Currently Married
Currently Married Comparison
Samoans
Nonimmigrants
46.8%
CURRENTLY MARRIED
59.8/ 100
METRIC RATING
165th/ 347
METRIC RANK
46.9%
CURRENTLY MARRIED
65.4/ 100
METRIC RATING
162nd/ 347
METRIC RANK
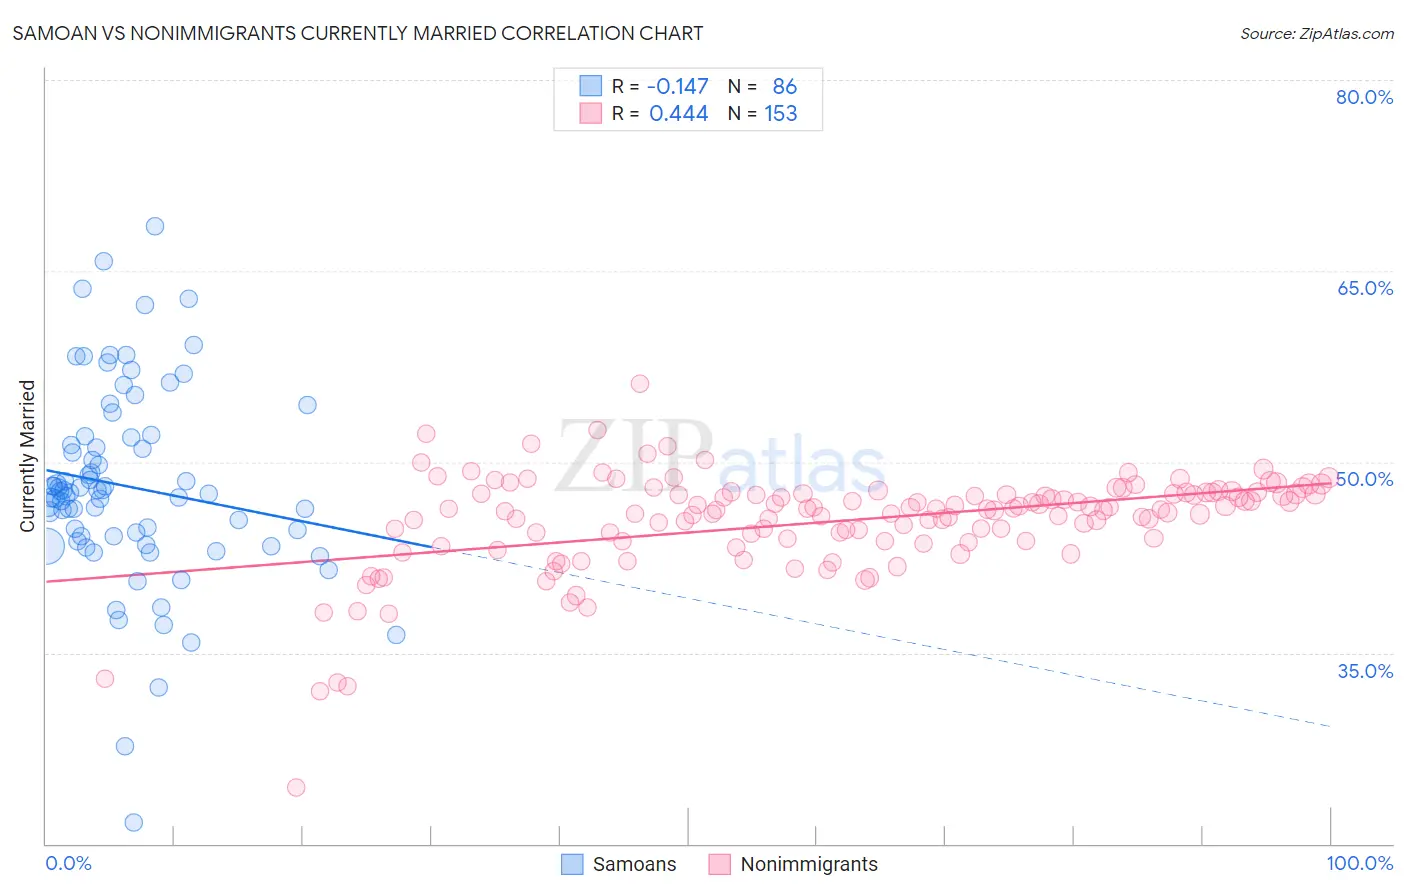
Samoan vs Nonimmigrants Currently Married Correlation Chart
The statistical analysis conducted on geographies consisting of 225,188,155 people shows a poor negative correlation between the proportion of Samoans and percentage of population currently married in the United States with a correlation coefficient (R) of -0.147 and weighted average of 46.8%. Similarly, the statistical analysis conducted on geographies consisting of 585,180,453 people shows a moderate positive correlation between the proportion of Nonimmigrants and percentage of population currently married in the United States with a correlation coefficient (R) of 0.444 and weighted average of 46.9%, a difference of 0.22%.
Currently Married Correlation Summary
| Measurement | Samoan | Nonimmigrants |
| Minimum | 21.7% | 24.5% |
| Maximum | 68.5% | 56.2% |
| Range | 46.8% | 31.7% |
| Mean | 48.1% | 45.3% |
| Median | 47.6% | 46.3% |
| Interquartile 25% (IQ1) | 44.1% | 43.8% |
| Interquartile 75% (IQ3) | 51.9% | 47.5% |
| Interquartile Range (IQR) | 7.8% | 3.7% |
| Standard Deviation (Sample) | 7.8% | 4.0% |
| Standard Deviation (Population) | 7.7% | 4.0% |
Demographics Similar to Samoans and Nonimmigrants by Currently Married
In terms of currently married, the demographic groups most similar to Samoans are Immigrants from Syria (46.8%, a difference of 0.020%), Spaniard (46.8%, a difference of 0.040%), Immigrants from Afghanistan (46.8%, a difference of 0.060%), Armenian (46.8%, a difference of 0.060%), and Immigrants from Latvia (46.7%, a difference of 0.11%). Similarly, the demographic groups most similar to Nonimmigrants are Immigrants from Uzbekistan (46.9%, a difference of 0.020%), Immigrants from Southern Europe (46.9%, a difference of 0.020%), Delaware (46.9%, a difference of 0.030%), Iraqi (46.9%, a difference of 0.040%), and Immigrants from Western Asia (46.9%, a difference of 0.050%).
| Demographics | Rating | Rank | Currently Married |
| Immigrants | Venezuela | 68.6 /100 | #153 | Good 47.0% |
| Albanians | 68.6 /100 | #154 | Good 47.0% |
| Arabs | 68.6 /100 | #155 | Good 47.0% |
| Spanish | 68.1 /100 | #156 | Good 47.0% |
| Immigrants | Switzerland | 67.8 /100 | #157 | Good 46.9% |
| Cherokee | 66.8 /100 | #158 | Good 46.9% |
| Iraqis | 66.4 /100 | #159 | Good 46.9% |
| Immigrants | Uzbekistan | 66.0 /100 | #160 | Good 46.9% |
| Immigrants | Southern Europe | 65.9 /100 | #161 | Good 46.9% |
| Immigrants | Nonimmigrants | 65.4 /100 | #162 | Good 46.9% |
| Delaware | 64.7 /100 | #163 | Good 46.9% |
| Immigrants | Western Asia | 64.2 /100 | #164 | Good 46.9% |
| Samoans | 59.8 /100 | #165 | Average 46.8% |
| Immigrants | Syria | 59.3 /100 | #166 | Average 46.8% |
| Spaniards | 58.8 /100 | #167 | Average 46.8% |
| Immigrants | Afghanistan | 58.2 /100 | #168 | Average 46.8% |
| Armenians | 58.2 /100 | #169 | Average 46.8% |
| Immigrants | Latvia | 56.7 /100 | #170 | Average 46.7% |
| Immigrants | Zimbabwe | 52.4 /100 | #171 | Average 46.7% |
| Aleuts | 52.0 /100 | #172 | Average 46.7% |
| Tlingit-Haida | 51.2 /100 | #173 | Average 46.7% |