Samoan vs Immigrants from Liberia Currently Married
COMPARE
Samoan
Immigrants from Liberia
Currently Married
Currently Married Comparison
Samoans
Immigrants from Liberia
46.8%
CURRENTLY MARRIED
59.8/ 100
METRIC RATING
165th/ 347
METRIC RANK
41.8%
CURRENTLY MARRIED
0.0/ 100
METRIC RATING
309th/ 347
METRIC RANK
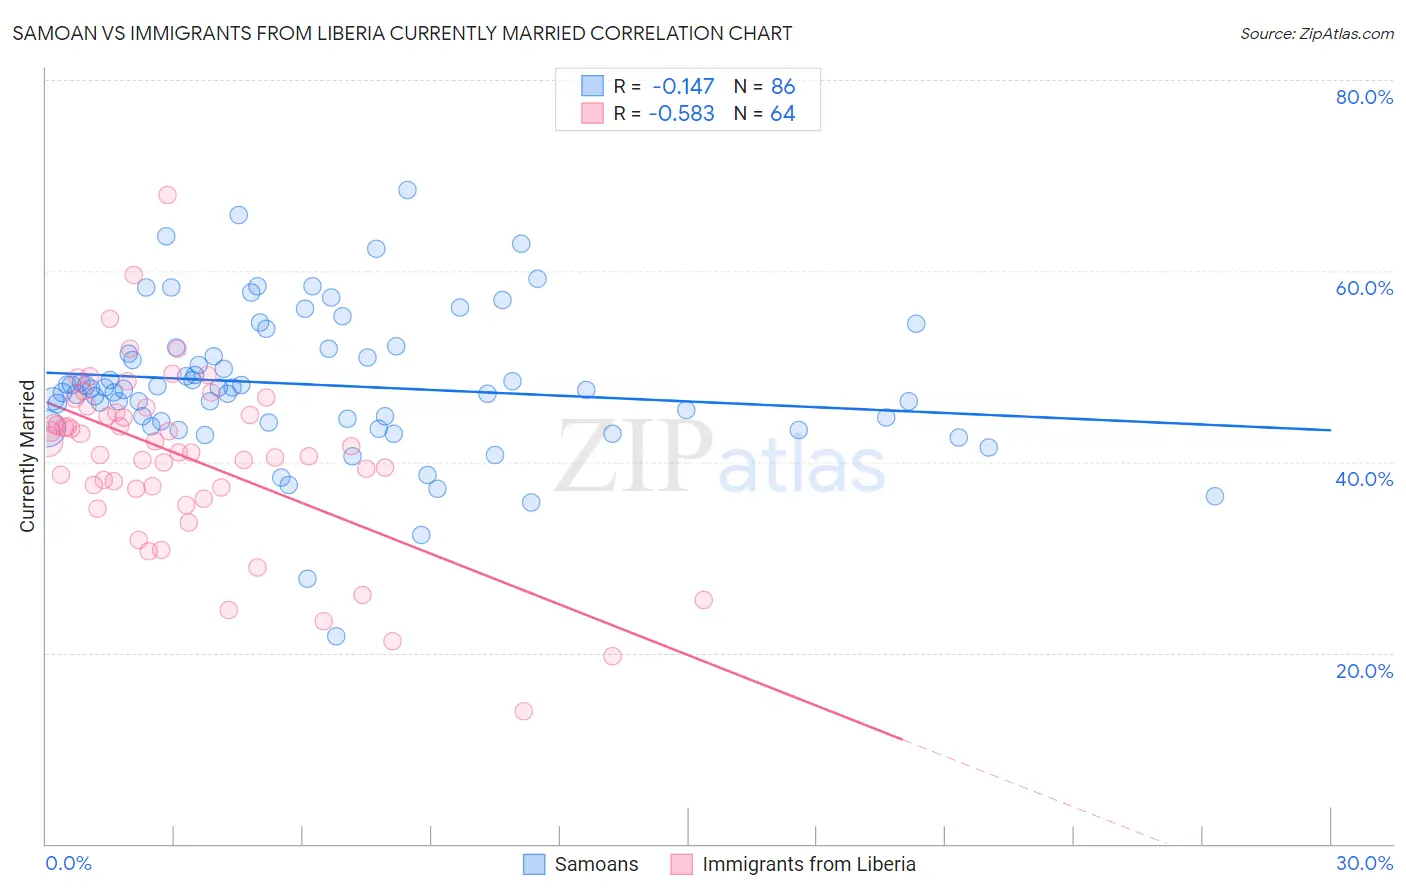
Samoan vs Immigrants from Liberia Currently Married Correlation Chart
The statistical analysis conducted on geographies consisting of 225,188,155 people shows a poor negative correlation between the proportion of Samoans and percentage of population currently married in the United States with a correlation coefficient (R) of -0.147 and weighted average of 46.8%. Similarly, the statistical analysis conducted on geographies consisting of 135,288,317 people shows a substantial negative correlation between the proportion of Immigrants from Liberia and percentage of population currently married in the United States with a correlation coefficient (R) of -0.583 and weighted average of 41.8%, a difference of 12.1%.
Currently Married Correlation Summary
| Measurement | Samoan | Immigrants from Liberia |
| Minimum | 21.7% | 13.9% |
| Maximum | 68.5% | 68.0% |
| Range | 46.8% | 54.1% |
| Mean | 48.1% | 40.5% |
| Median | 47.6% | 41.4% |
| Interquartile 25% (IQ1) | 44.1% | 37.3% |
| Interquartile 75% (IQ3) | 51.9% | 45.4% |
| Interquartile Range (IQR) | 7.8% | 8.2% |
| Standard Deviation (Sample) | 7.8% | 9.3% |
| Standard Deviation (Population) | 7.7% | 9.2% |
Similar Demographics by Currently Married
Demographics Similar to Samoans by Currently Married
In terms of currently married, the demographic groups most similar to Samoans are Immigrants from Syria (46.8%, a difference of 0.020%), Spaniard (46.8%, a difference of 0.040%), Immigrants from Afghanistan (46.8%, a difference of 0.060%), Armenian (46.8%, a difference of 0.060%), and Immigrants from Latvia (46.7%, a difference of 0.11%).
| Demographics | Rating | Rank | Currently Married |
| Cherokee | 66.8 /100 | #158 | Good 46.9% |
| Iraqis | 66.4 /100 | #159 | Good 46.9% |
| Immigrants | Uzbekistan | 66.0 /100 | #160 | Good 46.9% |
| Immigrants | Southern Europe | 65.9 /100 | #161 | Good 46.9% |
| Immigrants | Nonimmigrants | 65.4 /100 | #162 | Good 46.9% |
| Delaware | 64.7 /100 | #163 | Good 46.9% |
| Immigrants | Western Asia | 64.2 /100 | #164 | Good 46.9% |
| Samoans | 59.8 /100 | #165 | Average 46.8% |
| Immigrants | Syria | 59.3 /100 | #166 | Average 46.8% |
| Spaniards | 58.8 /100 | #167 | Average 46.8% |
| Immigrants | Afghanistan | 58.2 /100 | #168 | Average 46.8% |
| Armenians | 58.2 /100 | #169 | Average 46.8% |
| Immigrants | Latvia | 56.7 /100 | #170 | Average 46.7% |
| Immigrants | Zimbabwe | 52.4 /100 | #171 | Average 46.7% |
| Aleuts | 52.0 /100 | #172 | Average 46.7% |
Demographics Similar to Immigrants from Liberia by Currently Married
In terms of currently married, the demographic groups most similar to Immigrants from Liberia are Immigrants from Belize (41.8%, a difference of 0.11%), African (41.8%, a difference of 0.15%), Immigrants from Guyana (41.9%, a difference of 0.29%), Immigrants from Trinidad and Tobago (41.9%, a difference of 0.30%), and Immigrants from Bahamas (41.9%, a difference of 0.33%).
| Demographics | Rating | Rank | Currently Married |
| Immigrants | Zaire | 0.0 /100 | #302 | Tragic 42.0% |
| Sioux | 0.0 /100 | #303 | Tragic 41.9% |
| Immigrants | Bahamas | 0.0 /100 | #304 | Tragic 41.9% |
| Immigrants | Trinidad and Tobago | 0.0 /100 | #305 | Tragic 41.9% |
| Immigrants | Guyana | 0.0 /100 | #306 | Tragic 41.9% |
| Africans | 0.0 /100 | #307 | Tragic 41.8% |
| Immigrants | Belize | 0.0 /100 | #308 | Tragic 41.8% |
| Immigrants | Liberia | 0.0 /100 | #309 | Tragic 41.8% |
| Guyanese | 0.0 /100 | #310 | Tragic 41.6% |
| Trinidadians and Tobagonians | 0.0 /100 | #311 | Tragic 41.5% |
| Somalis | 0.0 /100 | #312 | Tragic 41.5% |
| Jamaicans | 0.0 /100 | #313 | Tragic 41.4% |
| West Indians | 0.0 /100 | #314 | Tragic 41.3% |
| Inupiat | 0.0 /100 | #315 | Tragic 41.3% |
| Immigrants | Caribbean | 0.0 /100 | #316 | Tragic 41.3% |