Romanian vs Immigrants from Zaire Divorced or Separated
COMPARE
Romanian
Immigrants from Zaire
Divorced or Separated
Divorced or Separated Comparison
Romanians
Immigrants from Zaire
11.8%
DIVORCED OR SEPARATED
94.5/ 100
METRIC RATING
121st/ 347
METRIC RANK
12.7%
DIVORCED OR SEPARATED
0.2/ 100
METRIC RATING
280th/ 347
METRIC RANK
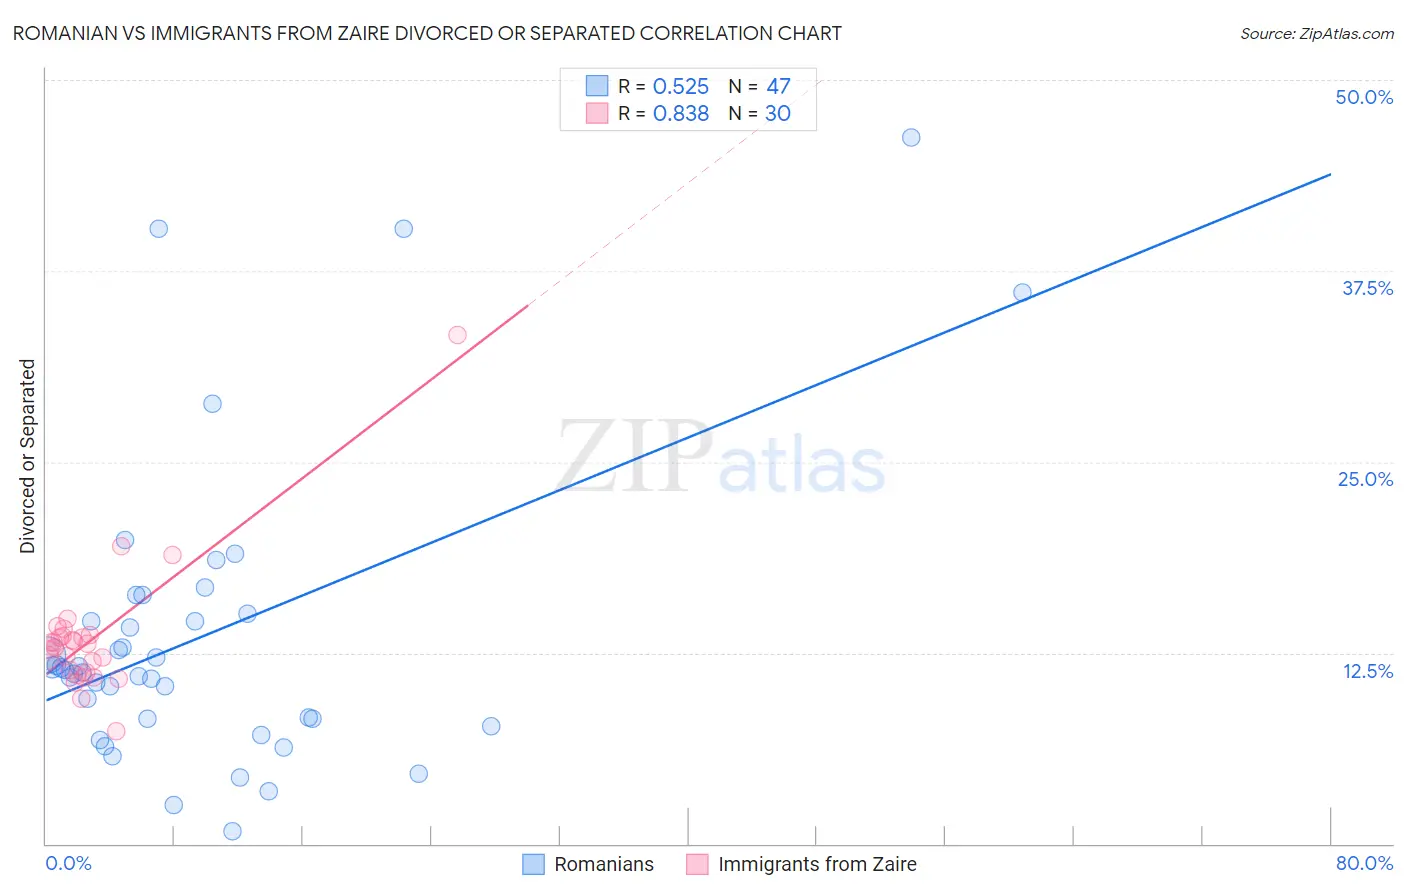
Romanian vs Immigrants from Zaire Divorced or Separated Correlation Chart
The statistical analysis conducted on geographies consisting of 377,785,427 people shows a substantial positive correlation between the proportion of Romanians and percentage of population currently divorced or separated in the United States with a correlation coefficient (R) of 0.525 and weighted average of 11.8%. Similarly, the statistical analysis conducted on geographies consisting of 107,244,131 people shows a very strong positive correlation between the proportion of Immigrants from Zaire and percentage of population currently divorced or separated in the United States with a correlation coefficient (R) of 0.838 and weighted average of 12.7%, a difference of 8.2%.
Divorced or Separated Correlation Summary
| Measurement | Romanian | Immigrants from Zaire |
| Minimum | 0.80% | 7.4% |
| Maximum | 46.2% | 33.3% |
| Range | 45.4% | 25.9% |
| Mean | 13.6% | 13.4% |
| Median | 11.4% | 13.0% |
| Interquartile 25% (IQ1) | 8.2% | 11.2% |
| Interquartile 75% (IQ3) | 15.0% | 13.6% |
| Interquartile Range (IQR) | 6.8% | 2.4% |
| Standard Deviation (Sample) | 9.8% | 4.4% |
| Standard Deviation (Population) | 9.7% | 4.3% |
Similar Demographics by Divorced or Separated
Demographics Similar to Romanians by Divorced or Separated
In terms of divorced or separated, the demographic groups most similar to Romanians are Iraqi (11.8%, a difference of 0.010%), Syrian (11.7%, a difference of 0.10%), Menominee (11.8%, a difference of 0.12%), Immigrants (11.8%, a difference of 0.13%), and Ecuadorian (11.7%, a difference of 0.14%).
| Demographics | Rating | Rank | Divorced or Separated |
| Immigrants | Norway | 95.9 /100 | #114 | Exceptional 11.7% |
| Lithuanians | 95.7 /100 | #115 | Exceptional 11.7% |
| Immigrants | Iraq | 95.4 /100 | #116 | Exceptional 11.7% |
| Immigrants | Uganda | 95.3 /100 | #117 | Exceptional 11.7% |
| Ecuadorians | 95.3 /100 | #118 | Exceptional 11.7% |
| Syrians | 95.1 /100 | #119 | Exceptional 11.7% |
| Iraqis | 94.6 /100 | #120 | Exceptional 11.8% |
| Romanians | 94.5 /100 | #121 | Exceptional 11.8% |
| Menominee | 93.8 /100 | #122 | Exceptional 11.8% |
| Immigrants | Immigrants | 93.7 /100 | #123 | Exceptional 11.8% |
| Ugandans | 93.1 /100 | #124 | Exceptional 11.8% |
| Ukrainians | 92.3 /100 | #125 | Exceptional 11.8% |
| South American Indians | 92.1 /100 | #126 | Exceptional 11.8% |
| South Africans | 88.9 /100 | #127 | Excellent 11.8% |
| Immigrants | Ecuador | 88.9 /100 | #128 | Excellent 11.8% |
Demographics Similar to Immigrants from Zaire by Divorced or Separated
In terms of divorced or separated, the demographic groups most similar to Immigrants from Zaire are Pueblo (12.7%, a difference of 0.040%), Immigrants from Dominican Republic (12.7%, a difference of 0.070%), Lumbee (12.7%, a difference of 0.080%), Subsaharan African (12.7%, a difference of 0.16%), and Delaware (12.7%, a difference of 0.17%).
| Demographics | Rating | Rank | Divorced or Separated |
| Immigrants | Micronesia | 0.3 /100 | #273 | Tragic 12.7% |
| Bermudans | 0.3 /100 | #274 | Tragic 12.7% |
| Central American Indians | 0.3 /100 | #275 | Tragic 12.7% |
| Spaniards | 0.2 /100 | #276 | Tragic 12.7% |
| Dominicans | 0.2 /100 | #277 | Tragic 12.7% |
| Lumbee | 0.2 /100 | #278 | Tragic 12.7% |
| Immigrants | Dominican Republic | 0.2 /100 | #279 | Tragic 12.7% |
| Immigrants | Zaire | 0.2 /100 | #280 | Tragic 12.7% |
| Pueblo | 0.2 /100 | #281 | Tragic 12.7% |
| Sub-Saharan Africans | 0.1 /100 | #282 | Tragic 12.7% |
| Delaware | 0.1 /100 | #283 | Tragic 12.7% |
| Immigrants | Nonimmigrants | 0.1 /100 | #284 | Tragic 12.8% |
| French | 0.1 /100 | #285 | Tragic 12.8% |
| Spanish | 0.1 /100 | #286 | Tragic 12.8% |
| Hondurans | 0.1 /100 | #287 | Tragic 12.8% |