Romanian vs Immigrants from Zaire No Vehicles in Household
COMPARE
Romanian
Immigrants from Zaire
No Vehicles in Household
No Vehicles in Household Comparison
Romanians
Immigrants from Zaire
10.9%
NO VEHICLES IN HOUSEHOLD
17.9/ 100
METRIC RATING
202nd/ 347
METRIC RANK
11.2%
NO VEHICLES IN HOUSEHOLD
9.6/ 100
METRIC RATING
220th/ 347
METRIC RANK
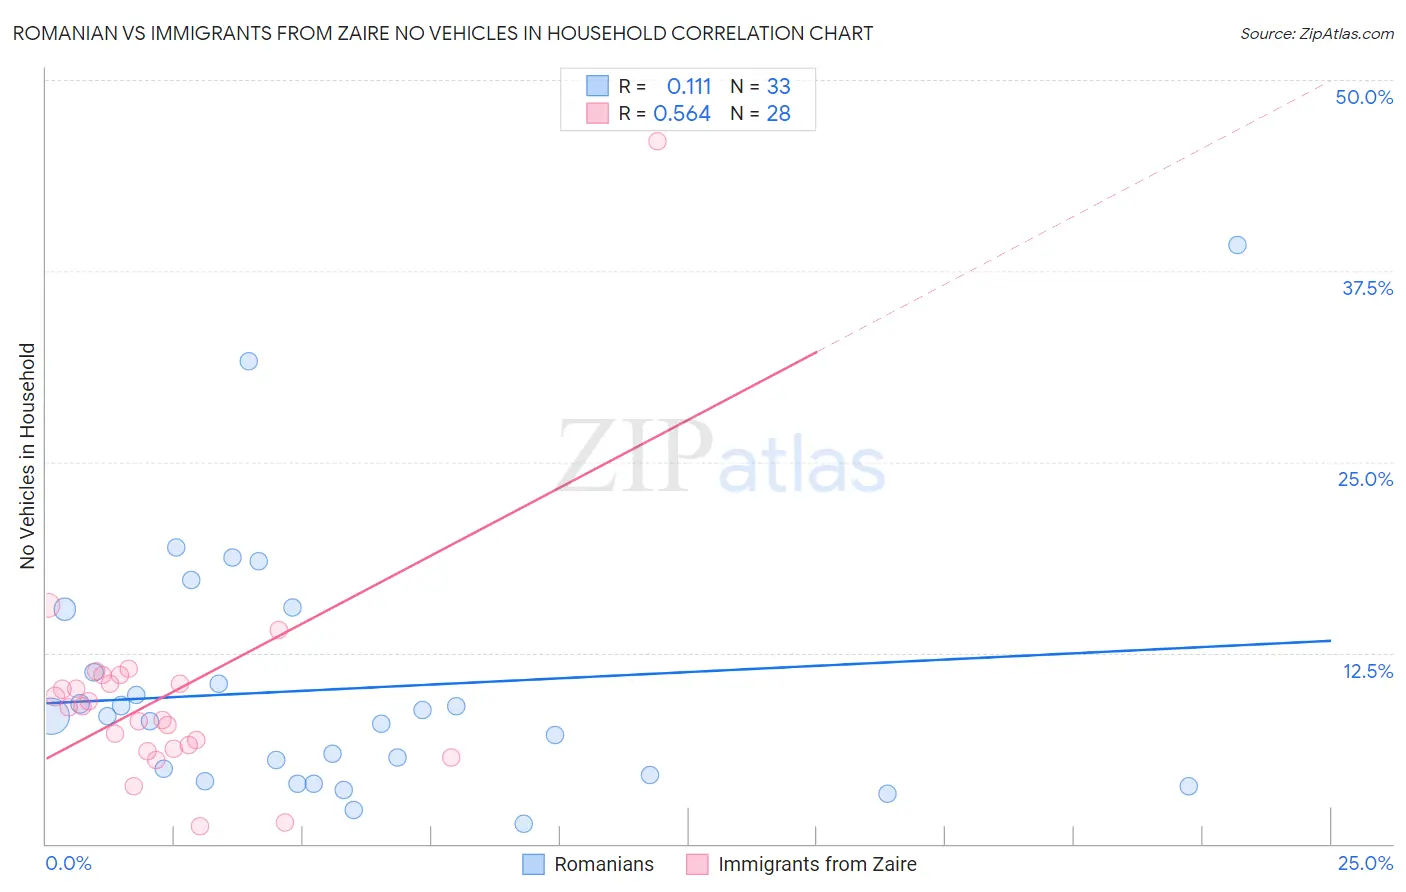
Romanian vs Immigrants from Zaire No Vehicles in Household Correlation Chart
The statistical analysis conducted on geographies consisting of 377,027,311 people shows a poor positive correlation between the proportion of Romanians and percentage of households with no vehicle available in the United States with a correlation coefficient (R) of 0.111 and weighted average of 10.9%. Similarly, the statistical analysis conducted on geographies consisting of 107,219,948 people shows a substantial positive correlation between the proportion of Immigrants from Zaire and percentage of households with no vehicle available in the United States with a correlation coefficient (R) of 0.564 and weighted average of 11.2%, a difference of 2.3%.
No Vehicles in Household Correlation Summary
| Measurement | Romanian | Immigrants from Zaire |
| Minimum | 1.3% | 1.2% |
| Maximum | 39.2% | 46.0% |
| Range | 37.9% | 44.8% |
| Mean | 10.2% | 9.7% |
| Median | 8.3% | 9.0% |
| Interquartile 25% (IQ1) | 4.3% | 6.4% |
| Interquartile 75% (IQ3) | 13.3% | 10.8% |
| Interquartile Range (IQR) | 9.0% | 4.4% |
| Standard Deviation (Sample) | 8.2% | 7.8% |
| Standard Deviation (Population) | 8.1% | 7.7% |
Demographics Similar to Romanians and Immigrants from Zaire by No Vehicles in Household
In terms of no vehicles in household, the demographic groups most similar to Romanians are Iroquois (10.9%, a difference of 0.070%), Immigrants from Western Europe (10.9%, a difference of 0.27%), Guatemalan (11.0%, a difference of 0.41%), Immigrants from Chile (11.0%, a difference of 0.45%), and Somali (11.0%, a difference of 0.45%). Similarly, the demographic groups most similar to Immigrants from Zaire are Argentinean (11.2%, a difference of 0.010%), Immigrants from Guatemala (11.2%, a difference of 0.14%), Dutch West Indian (11.2%, a difference of 0.24%), Immigrants from Argentina (11.2%, a difference of 0.36%), and Immigrants from Sri Lanka (11.2%, a difference of 0.37%).
| Demographics | Rating | Rank | No Vehicles in Household |
| Immigrants | Western Europe | 19.1 /100 | #201 | Poor 10.9% |
| Romanians | 17.9 /100 | #202 | Poor 10.9% |
| Iroquois | 17.6 /100 | #203 | Poor 10.9% |
| Guatemalans | 16.1 /100 | #204 | Poor 11.0% |
| Immigrants | Chile | 15.9 /100 | #205 | Poor 11.0% |
| Somalis | 15.9 /100 | #206 | Poor 11.0% |
| Sierra Leoneans | 15.7 /100 | #207 | Poor 11.0% |
| Immigrants | Italy | 15.6 /100 | #208 | Poor 11.0% |
| Pennsylvania Germans | 15.5 /100 | #209 | Poor 11.0% |
| Apache | 14.8 /100 | #210 | Poor 11.0% |
| Crow | 14.2 /100 | #211 | Poor 11.0% |
| Immigrants | Western Asia | 13.9 /100 | #212 | Poor 11.0% |
| Immigrants | Hungary | 12.3 /100 | #213 | Poor 11.1% |
| Immigrants | Denmark | 12.1 /100 | #214 | Poor 11.1% |
| Immigrants | Sri Lanka | 10.6 /100 | #215 | Poor 11.2% |
| Immigrants | Argentina | 10.6 /100 | #216 | Poor 11.2% |
| Dutch West Indians | 10.2 /100 | #217 | Poor 11.2% |
| Immigrants | Guatemala | 10.0 /100 | #218 | Tragic 11.2% |
| Argentineans | 9.6 /100 | #219 | Tragic 11.2% |
| Immigrants | Zaire | 9.6 /100 | #220 | Tragic 11.2% |
| Peruvians | 8.4 /100 | #221 | Tragic 11.2% |