Romanian vs Immigrants from Barbados Currently Married
COMPARE
Romanian
Immigrants from Barbados
Currently Married
Currently Married Comparison
Romanians
Immigrants from Barbados
48.4%
CURRENTLY MARRIED
98.5/ 100
METRIC RATING
61st/ 347
METRIC RANK
40.3%
CURRENTLY MARRIED
0.0/ 100
METRIC RATING
331st/ 347
METRIC RANK
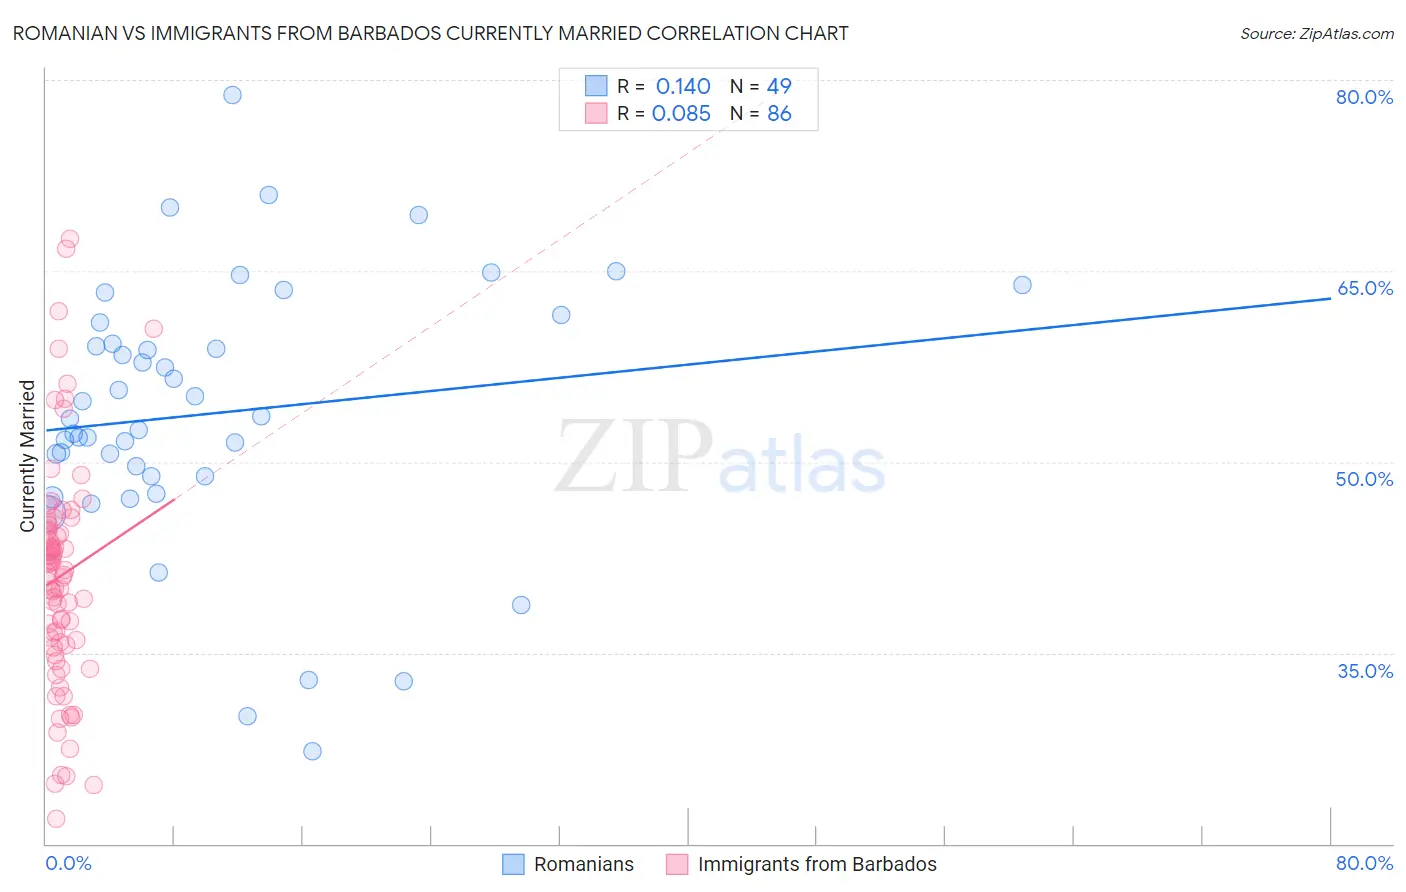
Romanian vs Immigrants from Barbados Currently Married Correlation Chart
The statistical analysis conducted on geographies consisting of 377,883,259 people shows a poor positive correlation between the proportion of Romanians and percentage of population currently married in the United States with a correlation coefficient (R) of 0.140 and weighted average of 48.4%. Similarly, the statistical analysis conducted on geographies consisting of 112,780,332 people shows a slight positive correlation between the proportion of Immigrants from Barbados and percentage of population currently married in the United States with a correlation coefficient (R) of 0.085 and weighted average of 40.3%, a difference of 20.0%.
Currently Married Correlation Summary
| Measurement | Romanian | Immigrants from Barbados |
| Minimum | 27.3% | 22.0% |
| Maximum | 78.8% | 67.5% |
| Range | 51.5% | 45.5% |
| Mean | 53.8% | 41.0% |
| Median | 53.4% | 41.3% |
| Interquartile 25% (IQ1) | 48.9% | 35.8% |
| Interquartile 75% (IQ3) | 60.1% | 44.6% |
| Interquartile Range (IQR) | 11.2% | 8.9% |
| Standard Deviation (Sample) | 10.5% | 8.9% |
| Standard Deviation (Population) | 10.4% | 8.9% |
Similar Demographics by Currently Married
Demographics Similar to Romanians by Currently Married
In terms of currently married, the demographic groups most similar to Romanians are Asian (48.4%, a difference of 0.0%), Immigrants from Romania (48.4%, a difference of 0.010%), Immigrants from Ireland (48.4%, a difference of 0.030%), French (48.4%, a difference of 0.050%), and Immigrants from Netherlands (48.5%, a difference of 0.10%).
| Demographics | Rating | Rank | Currently Married |
| Immigrants | Moldova | 98.7 /100 | #54 | Exceptional 48.5% |
| Immigrants | North Macedonia | 98.7 /100 | #55 | Exceptional 48.5% |
| Latvians | 98.7 /100 | #56 | Exceptional 48.5% |
| Immigrants | Netherlands | 98.6 /100 | #57 | Exceptional 48.5% |
| French | 98.6 /100 | #58 | Exceptional 48.4% |
| Immigrants | Ireland | 98.5 /100 | #59 | Exceptional 48.4% |
| Immigrants | Romania | 98.5 /100 | #60 | Exceptional 48.4% |
| Romanians | 98.5 /100 | #61 | Exceptional 48.4% |
| Asians | 98.5 /100 | #62 | Exceptional 48.4% |
| Slavs | 98.3 /100 | #63 | Exceptional 48.4% |
| Immigrants | Czechoslovakia | 98.3 /100 | #64 | Exceptional 48.4% |
| Ukrainians | 98.3 /100 | #65 | Exceptional 48.4% |
| Tongans | 98.2 /100 | #66 | Exceptional 48.3% |
| Slovaks | 98.2 /100 | #67 | Exceptional 48.3% |
| Immigrants | England | 98.2 /100 | #68 | Exceptional 48.3% |
Demographics Similar to Immigrants from Barbados by Currently Married
In terms of currently married, the demographic groups most similar to Immigrants from Barbados are Immigrants from Dominica (40.3%, a difference of 0.020%), Crow (40.4%, a difference of 0.10%), Arapaho (40.5%, a difference of 0.53%), Senegalese (40.6%, a difference of 0.58%), and Immigrants from St. Vincent and the Grenadines (40.1%, a difference of 0.67%).
| Demographics | Rating | Rank | Currently Married |
| Immigrants | Senegal | 0.0 /100 | #324 | Tragic 40.7% |
| U.S. Virgin Islanders | 0.0 /100 | #325 | Tragic 40.7% |
| Barbadians | 0.0 /100 | #326 | Tragic 40.6% |
| Senegalese | 0.0 /100 | #327 | Tragic 40.6% |
| Arapaho | 0.0 /100 | #328 | Tragic 40.5% |
| Crow | 0.0 /100 | #329 | Tragic 40.4% |
| Immigrants | Dominica | 0.0 /100 | #330 | Tragic 40.3% |
| Immigrants | Barbados | 0.0 /100 | #331 | Tragic 40.3% |
| Immigrants | St. Vincent and the Grenadines | 0.0 /100 | #332 | Tragic 40.1% |
| Yup'ik | 0.0 /100 | #333 | Tragic 39.9% |
| Puerto Ricans | 0.0 /100 | #334 | Tragic 39.9% |
| Lumbee | 0.0 /100 | #335 | Tragic 39.8% |
| British West Indians | 0.0 /100 | #336 | Tragic 39.8% |
| Blacks/African Americans | 0.0 /100 | #337 | Tragic 39.6% |
| Cape Verdeans | 0.0 /100 | #338 | Tragic 39.6% |