Romanian vs Immigrants from Zaire Median Earnings
COMPARE
Romanian
Immigrants from Zaire
Median Earnings
Median Earnings Comparison
Romanians
Immigrants from Zaire
$50,244
MEDIAN EARNINGS
99.5/ 100
METRIC RATING
83rd/ 347
METRIC RANK
$41,325
MEDIAN EARNINGS
0.1/ 100
METRIC RATING
293rd/ 347
METRIC RANK
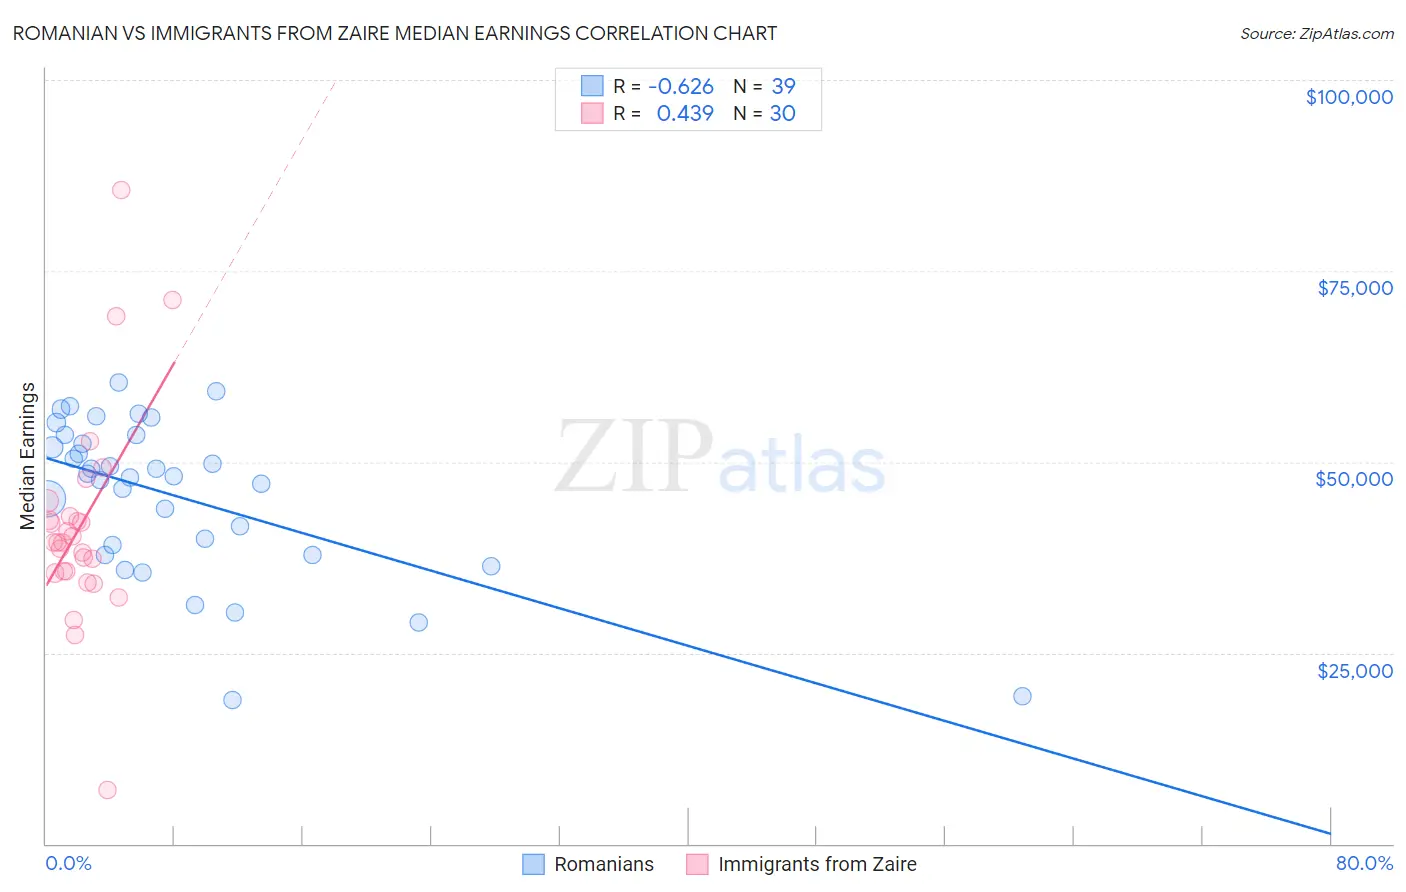
Romanian vs Immigrants from Zaire Median Earnings Correlation Chart
The statistical analysis conducted on geographies consisting of 377,906,078 people shows a significant negative correlation between the proportion of Romanians and median earnings in the United States with a correlation coefficient (R) of -0.626 and weighted average of $50,244. Similarly, the statistical analysis conducted on geographies consisting of 107,255,584 people shows a moderate positive correlation between the proportion of Immigrants from Zaire and median earnings in the United States with a correlation coefficient (R) of 0.439 and weighted average of $41,325, a difference of 21.6%.
Median Earnings Correlation Summary
| Measurement | Romanian | Immigrants from Zaire |
| Minimum | $18,814 | $7,065 |
| Maximum | $60,367 | $85,536 |
| Range | $41,553 | $78,471 |
| Mean | $45,500 | $41,788 |
| Median | $48,068 | $39,475 |
| Interquartile 25% (IQ1) | $37,750 | $35,616 |
| Interquartile 75% (IQ3) | $53,505 | $42,826 |
| Interquartile Range (IQR) | $15,755 | $7,210 |
| Standard Deviation (Sample) | $10,336 | $14,049 |
| Standard Deviation (Population) | $10,203 | $13,813 |
Similar Demographics by Median Earnings
Demographics Similar to Romanians by Median Earnings
In terms of median earnings, the demographic groups most similar to Romanians are Immigrants from Hungary ($50,227, a difference of 0.030%), Immigrants from Kazakhstan ($50,225, a difference of 0.040%), Immigrants from Moldova ($50,274, a difference of 0.060%), Immigrants from Southern Europe ($50,280, a difference of 0.070%), and Immigrants from Canada ($50,192, a difference of 0.10%).
| Demographics | Rating | Rank | Median Earnings |
| Immigrants | Italy | 99.7 /100 | #76 | Exceptional $50,581 |
| Immigrants | Western Europe | 99.7 /100 | #77 | Exceptional $50,549 |
| Argentineans | 99.6 /100 | #78 | Exceptional $50,399 |
| Laotians | 99.6 /100 | #79 | Exceptional $50,343 |
| Ukrainians | 99.6 /100 | #80 | Exceptional $50,320 |
| Immigrants | Southern Europe | 99.6 /100 | #81 | Exceptional $50,280 |
| Immigrants | Moldova | 99.5 /100 | #82 | Exceptional $50,274 |
| Romanians | 99.5 /100 | #83 | Exceptional $50,244 |
| Immigrants | Hungary | 99.5 /100 | #84 | Exceptional $50,227 |
| Immigrants | Kazakhstan | 99.5 /100 | #85 | Exceptional $50,225 |
| Immigrants | Canada | 99.5 /100 | #86 | Exceptional $50,192 |
| Immigrants | Uzbekistan | 99.5 /100 | #87 | Exceptional $50,151 |
| Albanians | 99.4 /100 | #88 | Exceptional $50,116 |
| Immigrants | North America | 99.4 /100 | #89 | Exceptional $50,108 |
| Italians | 99.3 /100 | #90 | Exceptional $49,915 |
Demographics Similar to Immigrants from Zaire by Median Earnings
In terms of median earnings, the demographic groups most similar to Immigrants from Zaire are Potawatomi ($41,288, a difference of 0.090%), Bangladeshi ($41,263, a difference of 0.15%), Cherokee ($41,252, a difference of 0.18%), Guatemalan ($41,205, a difference of 0.29%), and U.S. Virgin Islander ($41,448, a difference of 0.30%).
| Demographics | Rating | Rank | Median Earnings |
| Mexican American Indians | 0.1 /100 | #286 | Tragic $41,719 |
| Indonesians | 0.1 /100 | #287 | Tragic $41,701 |
| Immigrants | Dominican Republic | 0.1 /100 | #288 | Tragic $41,554 |
| Comanche | 0.1 /100 | #289 | Tragic $41,519 |
| Paiute | 0.1 /100 | #290 | Tragic $41,508 |
| Central American Indians | 0.1 /100 | #291 | Tragic $41,474 |
| U.S. Virgin Islanders | 0.1 /100 | #292 | Tragic $41,448 |
| Immigrants | Zaire | 0.1 /100 | #293 | Tragic $41,325 |
| Potawatomi | 0.1 /100 | #294 | Tragic $41,288 |
| Bangladeshis | 0.1 /100 | #295 | Tragic $41,263 |
| Cherokee | 0.1 /100 | #296 | Tragic $41,252 |
| Guatemalans | 0.1 /100 | #297 | Tragic $41,205 |
| Immigrants | Micronesia | 0.1 /100 | #298 | Tragic $41,133 |
| Immigrants | Caribbean | 0.1 /100 | #299 | Tragic $41,119 |
| Ute | 0.1 /100 | #300 | Tragic $41,051 |