Immigrants from Syria vs Immigrants from Norway Married-couple Households
COMPARE
Immigrants from Syria
Immigrants from Norway
Married-couple Households
Married-couple Households Comparison
Immigrants from Syria
Immigrants from Norway
47.1%
MARRIED-COUPLE HOUSEHOLDS
81.6/ 100
METRIC RATING
147th/ 347
METRIC RANK
46.5%
MARRIED-COUPLE HOUSEHOLDS
52.0/ 100
METRIC RATING
173rd/ 347
METRIC RANK
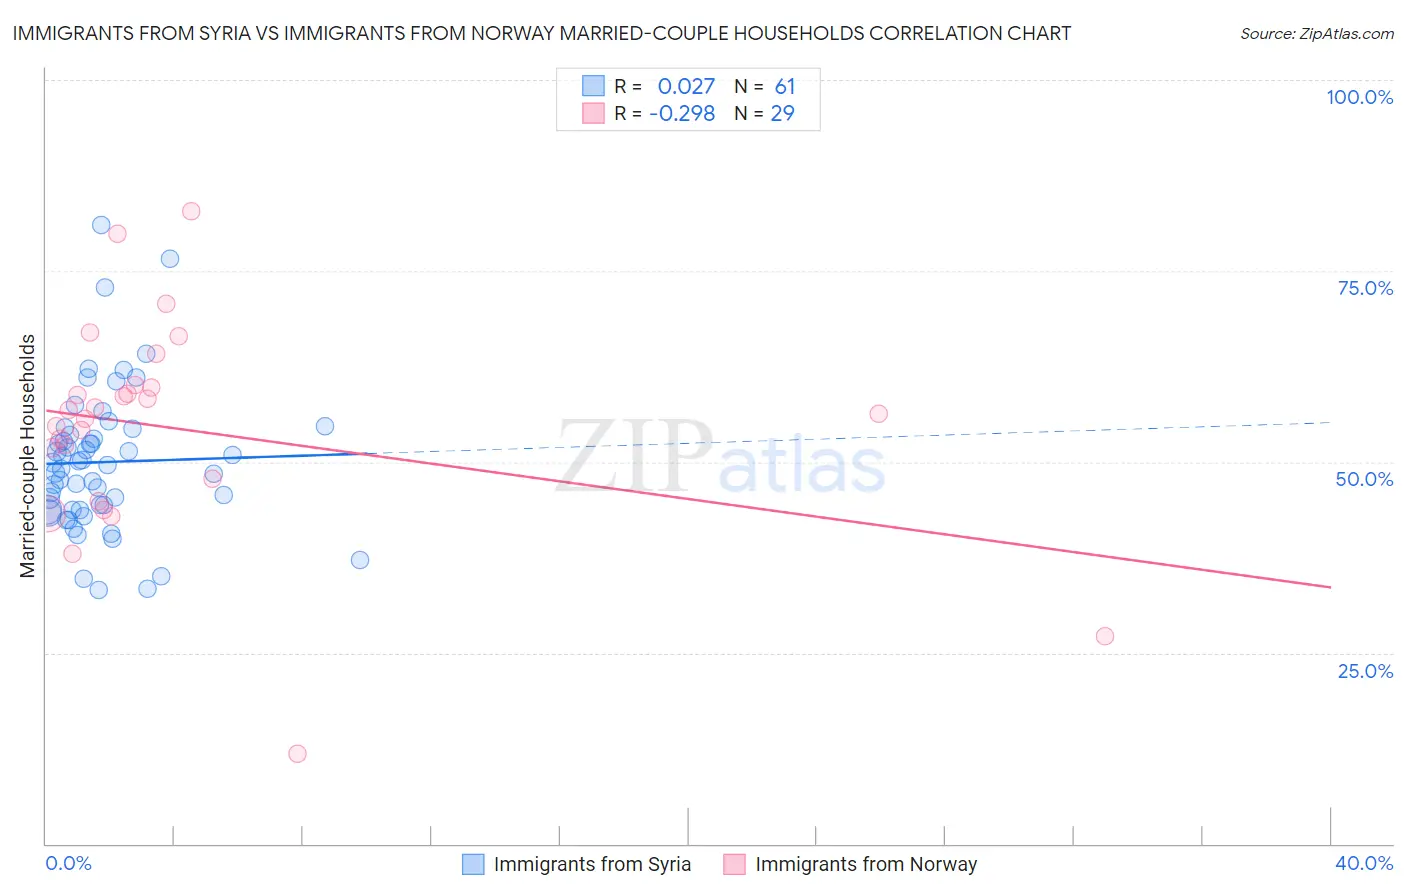
Immigrants from Syria vs Immigrants from Norway Married-couple Households Correlation Chart
The statistical analysis conducted on geographies consisting of 174,106,206 people shows no correlation between the proportion of Immigrants from Syria and percentage of married-couple family households in the United States with a correlation coefficient (R) of 0.027 and weighted average of 47.1%. Similarly, the statistical analysis conducted on geographies consisting of 116,686,104 people shows a weak negative correlation between the proportion of Immigrants from Norway and percentage of married-couple family households in the United States with a correlation coefficient (R) of -0.298 and weighted average of 46.5%, a difference of 1.3%.
Married-couple Households Correlation Summary
| Measurement | Immigrants from Syria | Immigrants from Norway |
| Minimum | 33.2% | 11.8% |
| Maximum | 81.0% | 82.8% |
| Range | 47.8% | 71.0% |
| Mean | 50.0% | 54.3% |
| Median | 49.5% | 56.2% |
| Interquartile 25% (IQ1) | 43.7% | 46.3% |
| Interquartile 75% (IQ3) | 53.9% | 59.8% |
| Interquartile Range (IQR) | 10.2% | 13.6% |
| Standard Deviation (Sample) | 9.4% | 14.2% |
| Standard Deviation (Population) | 9.4% | 13.9% |
Similar Demographics by Married-couple Households
Demographics Similar to Immigrants from Syria by Married-couple Households
In terms of married-couple households, the demographic groups most similar to Immigrants from Syria are Immigrants from Western Europe (47.1%, a difference of 0.0%), Slovene (47.1%, a difference of 0.010%), Mexican (47.1%, a difference of 0.12%), Icelander (47.0%, a difference of 0.12%), and Immigrants from Belarus (47.2%, a difference of 0.14%).
| Demographics | Rating | Rank | Married-couple Households |
| Spanish | 84.5 /100 | #140 | Excellent 47.2% |
| Costa Ricans | 84.4 /100 | #141 | Excellent 47.2% |
| Spaniards | 84.1 /100 | #142 | Excellent 47.2% |
| Immigrants | Belarus | 83.8 /100 | #143 | Excellent 47.2% |
| Mexicans | 83.4 /100 | #144 | Excellent 47.1% |
| Slovenes | 81.7 /100 | #145 | Excellent 47.1% |
| Immigrants | Western Europe | 81.6 /100 | #146 | Excellent 47.1% |
| Immigrants | Syria | 81.6 /100 | #147 | Excellent 47.1% |
| Icelanders | 79.5 /100 | #148 | Good 47.0% |
| Paraguayans | 78.7 /100 | #149 | Good 47.0% |
| Immigrants | Russia | 77.6 /100 | #150 | Good 47.0% |
| Immigrants | Bulgaria | 76.8 /100 | #151 | Good 47.0% |
| Serbians | 76.3 /100 | #152 | Good 47.0% |
| Hmong | 76.2 /100 | #153 | Good 47.0% |
| Immigrants | Western Asia | 76.1 /100 | #154 | Good 46.9% |
Demographics Similar to Immigrants from Norway by Married-couple Households
In terms of married-couple households, the demographic groups most similar to Immigrants from Norway are Immigrants from Mexico (46.4%, a difference of 0.070%), Immigrants from Australia (46.5%, a difference of 0.10%), Immigrants from Chile (46.5%, a difference of 0.14%), Immigrants from Colombia (46.4%, a difference of 0.22%), and South American (46.6%, a difference of 0.23%).
| Demographics | Rating | Rank | Married-couple Households |
| Cherokee | 65.7 /100 | #166 | Good 46.7% |
| Immigrants | Croatia | 64.2 /100 | #167 | Good 46.7% |
| Israelis | 62.3 /100 | #168 | Good 46.7% |
| Spanish American Indians | 59.4 /100 | #169 | Average 46.6% |
| South Americans | 58.0 /100 | #170 | Average 46.6% |
| Immigrants | Chile | 55.7 /100 | #171 | Average 46.5% |
| Immigrants | Australia | 54.6 /100 | #172 | Average 46.5% |
| Immigrants | Norway | 52.0 /100 | #173 | Average 46.5% |
| Immigrants | Mexico | 50.0 /100 | #174 | Average 46.4% |
| Immigrants | Colombia | 46.1 /100 | #175 | Average 46.4% |
| Cajuns | 45.2 /100 | #176 | Average 46.4% |
| Immigrants | Immigrants | 43.8 /100 | #177 | Average 46.3% |
| Immigrants | Costa Rica | 43.4 /100 | #178 | Average 46.3% |
| Immigrants | Zimbabwe | 43.0 /100 | #179 | Average 46.3% |
| Mongolians | 42.0 /100 | #180 | Average 46.3% |