Norwegian vs Immigrants from Norway Married-couple Households
COMPARE
Norwegian
Immigrants from Norway
Married-couple Households
Married-couple Households Comparison
Norwegians
Immigrants from Norway
49.5%
MARRIED-COUPLE HOUSEHOLDS
99.9/ 100
METRIC RATING
21st/ 347
METRIC RANK
46.5%
MARRIED-COUPLE HOUSEHOLDS
52.0/ 100
METRIC RATING
173rd/ 347
METRIC RANK
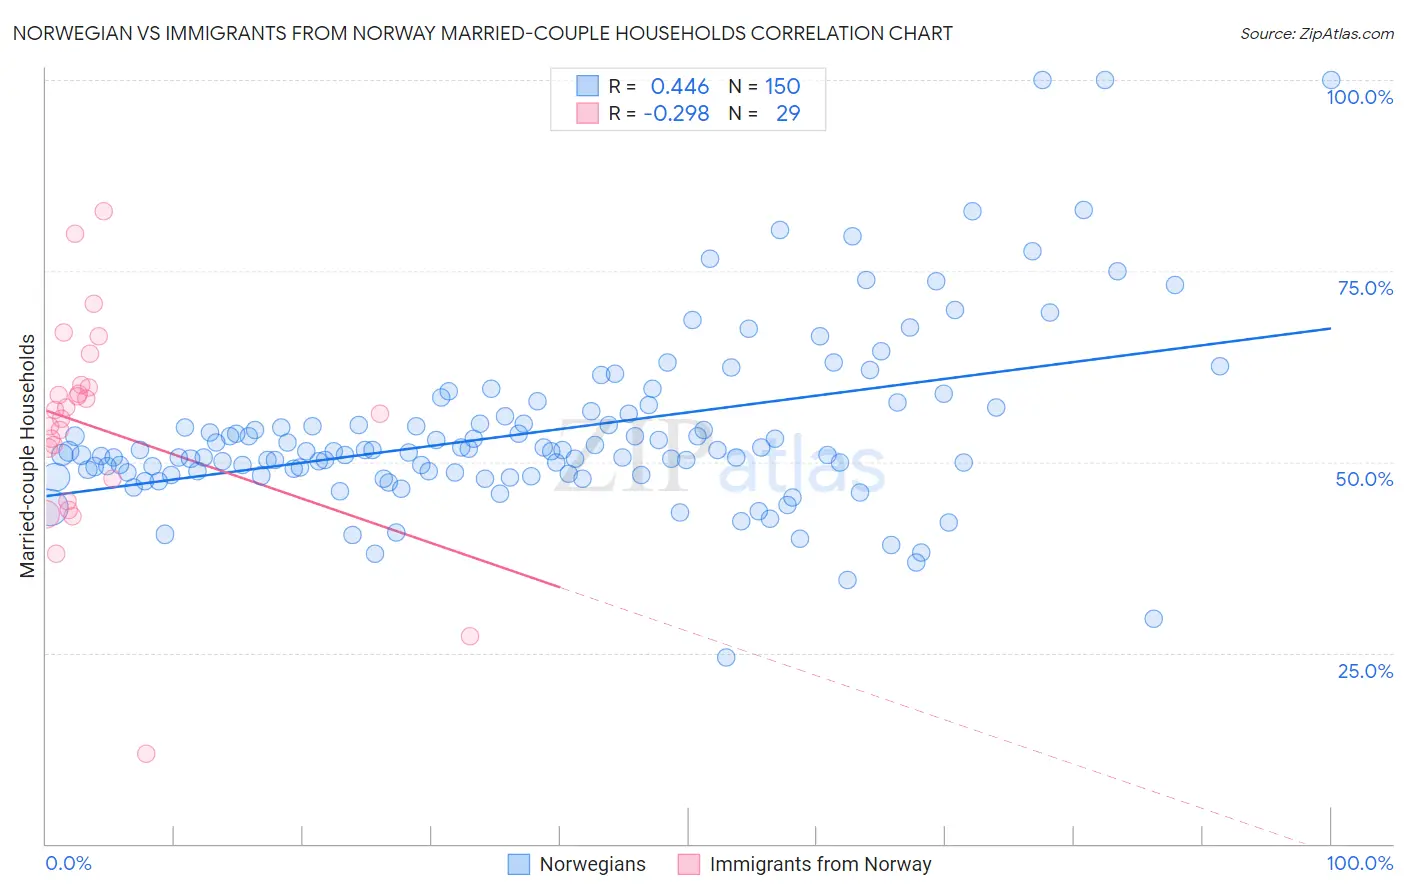
Norwegian vs Immigrants from Norway Married-couple Households Correlation Chart
The statistical analysis conducted on geographies consisting of 532,882,581 people shows a moderate positive correlation between the proportion of Norwegians and percentage of married-couple family households in the United States with a correlation coefficient (R) of 0.446 and weighted average of 49.5%. Similarly, the statistical analysis conducted on geographies consisting of 116,686,104 people shows a weak negative correlation between the proportion of Immigrants from Norway and percentage of married-couple family households in the United States with a correlation coefficient (R) of -0.298 and weighted average of 46.5%, a difference of 6.6%.
Married-couple Households Correlation Summary
| Measurement | Norwegian | Immigrants from Norway |
| Minimum | 24.5% | 11.8% |
| Maximum | 100.0% | 82.8% |
| Range | 75.5% | 71.0% |
| Mean | 54.0% | 54.3% |
| Median | 51.4% | 56.2% |
| Interquartile 25% (IQ1) | 48.6% | 46.3% |
| Interquartile 75% (IQ3) | 56.3% | 59.8% |
| Interquartile Range (IQR) | 7.7% | 13.6% |
| Standard Deviation (Sample) | 11.6% | 14.2% |
| Standard Deviation (Population) | 11.6% | 13.9% |
Similar Demographics by Married-couple Households
Demographics Similar to Norwegians by Married-couple Households
In terms of married-couple households, the demographic groups most similar to Norwegians are Scandinavian (49.6%, a difference of 0.050%), European (49.6%, a difference of 0.060%), Asian (49.5%, a difference of 0.11%), Dutch (49.5%, a difference of 0.12%), and Czech (49.4%, a difference of 0.20%).
| Demographics | Rating | Rank | Married-couple Households |
| Burmese | 100.0 /100 | #14 | Exceptional 49.8% |
| Koreans | 99.9 /100 | #15 | Exceptional 49.7% |
| Swedes | 99.9 /100 | #16 | Exceptional 49.7% |
| Immigrants | Hong Kong | 99.9 /100 | #17 | Exceptional 49.6% |
| English | 99.9 /100 | #18 | Exceptional 49.6% |
| Europeans | 99.9 /100 | #19 | Exceptional 49.6% |
| Scandinavians | 99.9 /100 | #20 | Exceptional 49.6% |
| Norwegians | 99.9 /100 | #21 | Exceptional 49.5% |
| Asians | 99.9 /100 | #22 | Exceptional 49.5% |
| Dutch | 99.9 /100 | #23 | Exceptional 49.5% |
| Czechs | 99.9 /100 | #24 | Exceptional 49.4% |
| Immigrants | Philippines | 99.9 /100 | #25 | Exceptional 49.3% |
| Immigrants | Scotland | 99.8 /100 | #26 | Exceptional 49.3% |
| Bhutanese | 99.8 /100 | #27 | Exceptional 49.3% |
| Germans | 99.8 /100 | #28 | Exceptional 49.2% |
Demographics Similar to Immigrants from Norway by Married-couple Households
In terms of married-couple households, the demographic groups most similar to Immigrants from Norway are Immigrants from Mexico (46.4%, a difference of 0.070%), Immigrants from Australia (46.5%, a difference of 0.10%), Immigrants from Chile (46.5%, a difference of 0.14%), Immigrants from Colombia (46.4%, a difference of 0.22%), and South American (46.6%, a difference of 0.23%).
| Demographics | Rating | Rank | Married-couple Households |
| Cherokee | 65.7 /100 | #166 | Good 46.7% |
| Immigrants | Croatia | 64.2 /100 | #167 | Good 46.7% |
| Israelis | 62.3 /100 | #168 | Good 46.7% |
| Spanish American Indians | 59.4 /100 | #169 | Average 46.6% |
| South Americans | 58.0 /100 | #170 | Average 46.6% |
| Immigrants | Chile | 55.7 /100 | #171 | Average 46.5% |
| Immigrants | Australia | 54.6 /100 | #172 | Average 46.5% |
| Immigrants | Norway | 52.0 /100 | #173 | Average 46.5% |
| Immigrants | Mexico | 50.0 /100 | #174 | Average 46.4% |
| Immigrants | Colombia | 46.1 /100 | #175 | Average 46.4% |
| Cajuns | 45.2 /100 | #176 | Average 46.4% |
| Immigrants | Immigrants | 43.8 /100 | #177 | Average 46.3% |
| Immigrants | Costa Rica | 43.4 /100 | #178 | Average 46.3% |
| Immigrants | Zimbabwe | 43.0 /100 | #179 | Average 46.3% |
| Mongolians | 42.0 /100 | #180 | Average 46.3% |