Immigrants from Portugal vs Immigrants from Norway Married-couple Households
COMPARE
Immigrants from Portugal
Immigrants from Norway
Married-couple Households
Married-couple Households Comparison
Immigrants from Portugal
Immigrants from Norway
45.2%
MARRIED-COUPLE HOUSEHOLDS
5.6/ 100
METRIC RATING
216th/ 347
METRIC RANK
46.5%
MARRIED-COUPLE HOUSEHOLDS
52.0/ 100
METRIC RATING
173rd/ 347
METRIC RANK
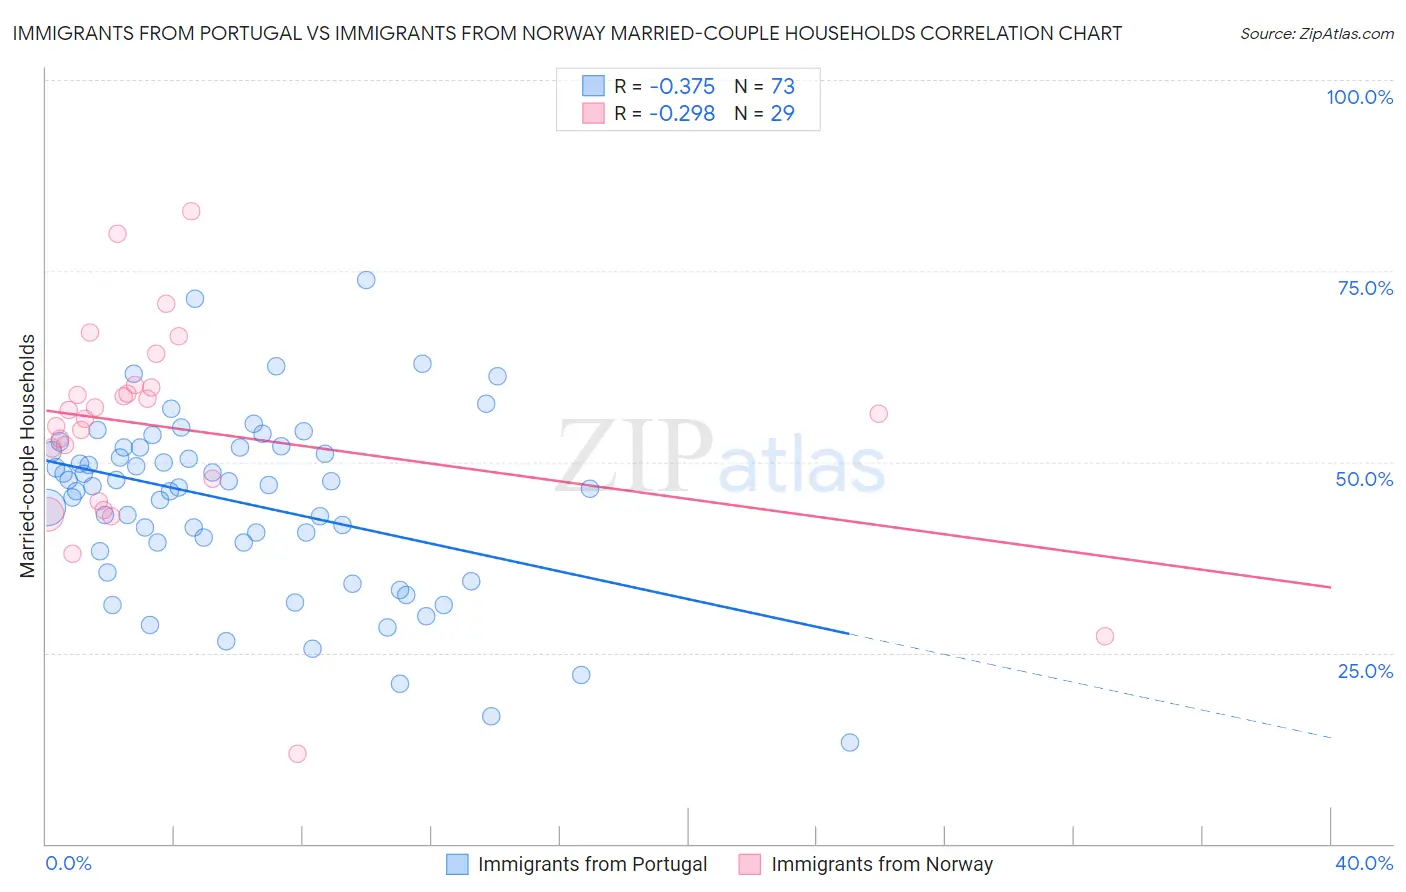
Immigrants from Portugal vs Immigrants from Norway Married-couple Households Correlation Chart
The statistical analysis conducted on geographies consisting of 174,766,894 people shows a mild negative correlation between the proportion of Immigrants from Portugal and percentage of married-couple family households in the United States with a correlation coefficient (R) of -0.375 and weighted average of 45.2%. Similarly, the statistical analysis conducted on geographies consisting of 116,686,104 people shows a weak negative correlation between the proportion of Immigrants from Norway and percentage of married-couple family households in the United States with a correlation coefficient (R) of -0.298 and weighted average of 46.5%, a difference of 2.8%.
Married-couple Households Correlation Summary
| Measurement | Immigrants from Portugal | Immigrants from Norway |
| Minimum | 13.2% | 11.8% |
| Maximum | 73.9% | 82.8% |
| Range | 60.7% | 71.0% |
| Mean | 44.7% | 54.3% |
| Median | 46.8% | 56.2% |
| Interquartile 25% (IQ1) | 38.8% | 46.3% |
| Interquartile 75% (IQ3) | 51.9% | 59.8% |
| Interquartile Range (IQR) | 13.1% | 13.6% |
| Standard Deviation (Sample) | 11.7% | 14.2% |
| Standard Deviation (Population) | 11.6% | 13.9% |
Similar Demographics by Married-couple Households
Demographics Similar to Immigrants from Portugal by Married-couple Households
In terms of married-couple households, the demographic groups most similar to Immigrants from Portugal are Immigrants from Nepal (45.2%, a difference of 0.0%), Japanese (45.2%, a difference of 0.020%), Panamanian (45.2%, a difference of 0.020%), Yakama (45.2%, a difference of 0.050%), and Immigrants from the Azores (45.2%, a difference of 0.050%).
| Demographics | Rating | Rank | Married-couple Households |
| Immigrants | Uzbekistan | 8.4 /100 | #209 | Tragic 45.4% |
| Cubans | 7.7 /100 | #210 | Tragic 45.4% |
| Immigrants | Spain | 7.3 /100 | #211 | Tragic 45.3% |
| Creek | 6.4 /100 | #212 | Tragic 45.3% |
| Yakama | 5.8 /100 | #213 | Tragic 45.2% |
| Japanese | 5.7 /100 | #214 | Tragic 45.2% |
| Immigrants | Nepal | 5.6 /100 | #215 | Tragic 45.2% |
| Immigrants | Portugal | 5.6 /100 | #216 | Tragic 45.2% |
| Panamanians | 5.5 /100 | #217 | Tragic 45.2% |
| Immigrants | Azores | 5.3 /100 | #218 | Tragic 45.2% |
| Nicaraguans | 5.3 /100 | #219 | Tragic 45.2% |
| Immigrants | Thailand | 5.1 /100 | #220 | Tragic 45.2% |
| Tlingit-Haida | 4.9 /100 | #221 | Tragic 45.1% |
| Immigrants | Laos | 4.6 /100 | #222 | Tragic 45.1% |
| Immigrants | Cambodia | 2.7 /100 | #223 | Tragic 44.9% |
Demographics Similar to Immigrants from Norway by Married-couple Households
In terms of married-couple households, the demographic groups most similar to Immigrants from Norway are Immigrants from Mexico (46.4%, a difference of 0.070%), Immigrants from Australia (46.5%, a difference of 0.10%), Immigrants from Chile (46.5%, a difference of 0.14%), Immigrants from Colombia (46.4%, a difference of 0.22%), and South American (46.6%, a difference of 0.23%).
| Demographics | Rating | Rank | Married-couple Households |
| Cherokee | 65.7 /100 | #166 | Good 46.7% |
| Immigrants | Croatia | 64.2 /100 | #167 | Good 46.7% |
| Israelis | 62.3 /100 | #168 | Good 46.7% |
| Spanish American Indians | 59.4 /100 | #169 | Average 46.6% |
| South Americans | 58.0 /100 | #170 | Average 46.6% |
| Immigrants | Chile | 55.7 /100 | #171 | Average 46.5% |
| Immigrants | Australia | 54.6 /100 | #172 | Average 46.5% |
| Immigrants | Norway | 52.0 /100 | #173 | Average 46.5% |
| Immigrants | Mexico | 50.0 /100 | #174 | Average 46.4% |
| Immigrants | Colombia | 46.1 /100 | #175 | Average 46.4% |
| Cajuns | 45.2 /100 | #176 | Average 46.4% |
| Immigrants | Immigrants | 43.8 /100 | #177 | Average 46.3% |
| Immigrants | Costa Rica | 43.4 /100 | #178 | Average 46.3% |
| Immigrants | Zimbabwe | 43.0 /100 | #179 | Average 46.3% |
| Mongolians | 42.0 /100 | #180 | Average 46.3% |