Immigrants from Burma/Myanmar vs Chilean Average Family Size
COMPARE
Immigrants from Burma/Myanmar
Chilean
Average Family Size
Average Family Size Comparison
Immigrants from Burma/Myanmar
Chileans
3.29
AVERAGE FAMILY SIZE
98.6/ 100
METRIC RATING
101st/ 347
METRIC RANK
3.23
AVERAGE FAMILY SIZE
53.2/ 100
METRIC RATING
171st/ 347
METRIC RANK
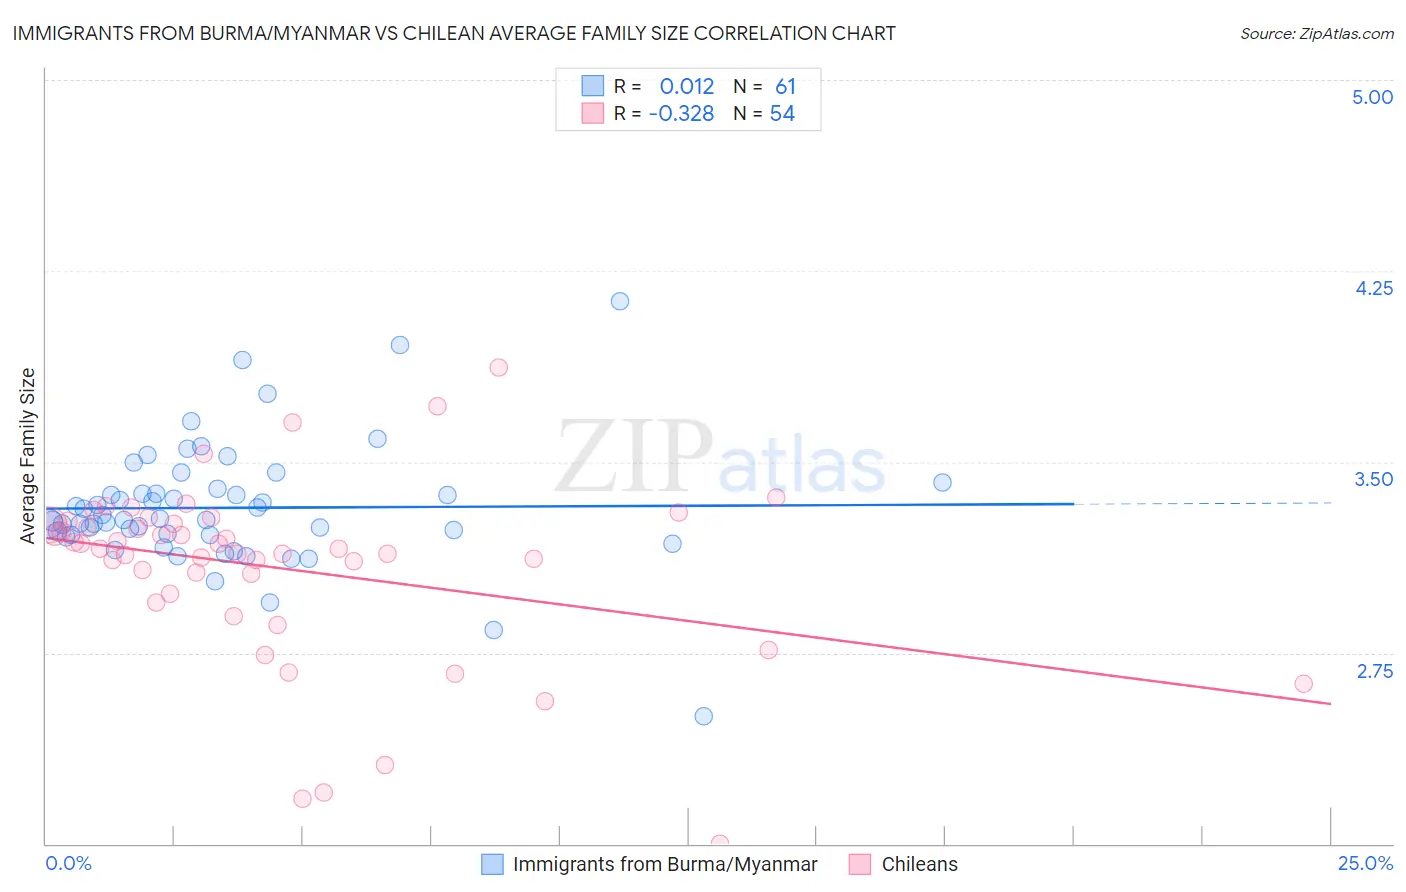
Immigrants from Burma/Myanmar vs Chilean Average Family Size Correlation Chart
The statistical analysis conducted on geographies consisting of 172,260,665 people shows no correlation between the proportion of Immigrants from Burma/Myanmar and average family size in the United States with a correlation coefficient (R) of 0.012 and weighted average of 3.29. Similarly, the statistical analysis conducted on geographies consisting of 256,563,974 people shows a mild negative correlation between the proportion of Chileans and average family size in the United States with a correlation coefficient (R) of -0.328 and weighted average of 3.23, a difference of 1.9%.
Average Family Size Correlation Summary
| Measurement | Immigrants from Burma/Myanmar | Chilean |
| Minimum | 2.50 | 2.00 |
| Maximum | 4.13 | 3.87 |
| Range | 1.63 | 1.87 |
| Mean | 3.32 | 3.08 |
| Median | 3.27 | 3.16 |
| Interquartile 25% (IQ1) | 3.21 | 2.98 |
| Interquartile 75% (IQ3) | 3.39 | 3.26 |
| Interquartile Range (IQR) | 0.17 | 0.27 |
| Standard Deviation (Sample) | 0.25 | 0.36 |
| Standard Deviation (Population) | 0.24 | 0.35 |
Similar Demographics by Average Family Size
Demographics Similar to Immigrants from Burma/Myanmar by Average Family Size
In terms of average family size, the demographic groups most similar to Immigrants from Burma/Myanmar are West Indian (3.29, a difference of 0.010%), Nigerian (3.29, a difference of 0.020%), Guamanian/Chamorro (3.29, a difference of 0.020%), Immigrants from Oceania (3.29, a difference of 0.030%), and Barbadian (3.29, a difference of 0.030%).
| Demographics | Rating | Rank | Average Family Size |
| Sierra Leoneans | 99.0 /100 | #94 | Exceptional 3.30 |
| Immigrants | Lebanon | 99.0 /100 | #95 | Exceptional 3.30 |
| U.S. Virgin Islanders | 98.8 /100 | #96 | Exceptional 3.29 |
| Immigrants | Oceania | 98.7 /100 | #97 | Exceptional 3.29 |
| Barbadians | 98.6 /100 | #98 | Exceptional 3.29 |
| Nigerians | 98.6 /100 | #99 | Exceptional 3.29 |
| Guamanians/Chamorros | 98.6 /100 | #100 | Exceptional 3.29 |
| Immigrants | Burma/Myanmar | 98.6 /100 | #101 | Exceptional 3.29 |
| West Indians | 98.5 /100 | #102 | Exceptional 3.29 |
| Immigrants | Western Africa | 98.4 /100 | #103 | Exceptional 3.29 |
| Bolivians | 98.3 /100 | #104 | Exceptional 3.29 |
| Immigrants | Ghana | 98.1 /100 | #105 | Exceptional 3.29 |
| Paiute | 98.0 /100 | #106 | Exceptional 3.29 |
| Ghanaians | 98.0 /100 | #107 | Exceptional 3.29 |
| Asians | 97.0 /100 | #108 | Exceptional 3.28 |
Demographics Similar to Chileans by Average Family Size
In terms of average family size, the demographic groups most similar to Chileans are Arab (3.23, a difference of 0.010%), Immigrants from Congo (3.23, a difference of 0.010%), Taiwanese (3.23, a difference of 0.020%), Aleut (3.23, a difference of 0.020%), and Immigrants from Uruguay (3.23, a difference of 0.020%).
| Demographics | Rating | Rank | Average Family Size |
| Egyptians | 58.6 /100 | #164 | Average 3.23 |
| Ugandans | 58.4 /100 | #165 | Average 3.23 |
| Immigrants | Senegal | 57.5 /100 | #166 | Average 3.23 |
| Dutch West Indians | 56.9 /100 | #167 | Average 3.23 |
| Taiwanese | 54.2 /100 | #168 | Average 3.23 |
| Aleuts | 54.1 /100 | #169 | Average 3.23 |
| Arabs | 53.8 /100 | #170 | Average 3.23 |
| Chileans | 53.2 /100 | #171 | Average 3.23 |
| Immigrants | Congo | 52.7 /100 | #172 | Average 3.23 |
| Immigrants | Uruguay | 52.0 /100 | #173 | Average 3.23 |
| Immigrants | South Central Asia | 50.0 /100 | #174 | Average 3.23 |
| Immigrants | China | 49.9 /100 | #175 | Average 3.23 |
| Israelis | 48.7 /100 | #176 | Average 3.23 |
| Argentineans | 47.4 /100 | #177 | Average 3.23 |
| Spaniards | 47.2 /100 | #178 | Average 3.23 |