Immigrants from Scotland vs Bulgarian Average Family Size
COMPARE
Immigrants from Scotland
Bulgarian
Average Family Size
Average Family Size Comparison
Immigrants from Scotland
Bulgarians
3.12
AVERAGE FAMILY SIZE
0.1/ 100
METRIC RATING
315th/ 347
METRIC RANK
3.13
AVERAGE FAMILY SIZE
0.1/ 100
METRIC RATING
313th/ 347
METRIC RANK
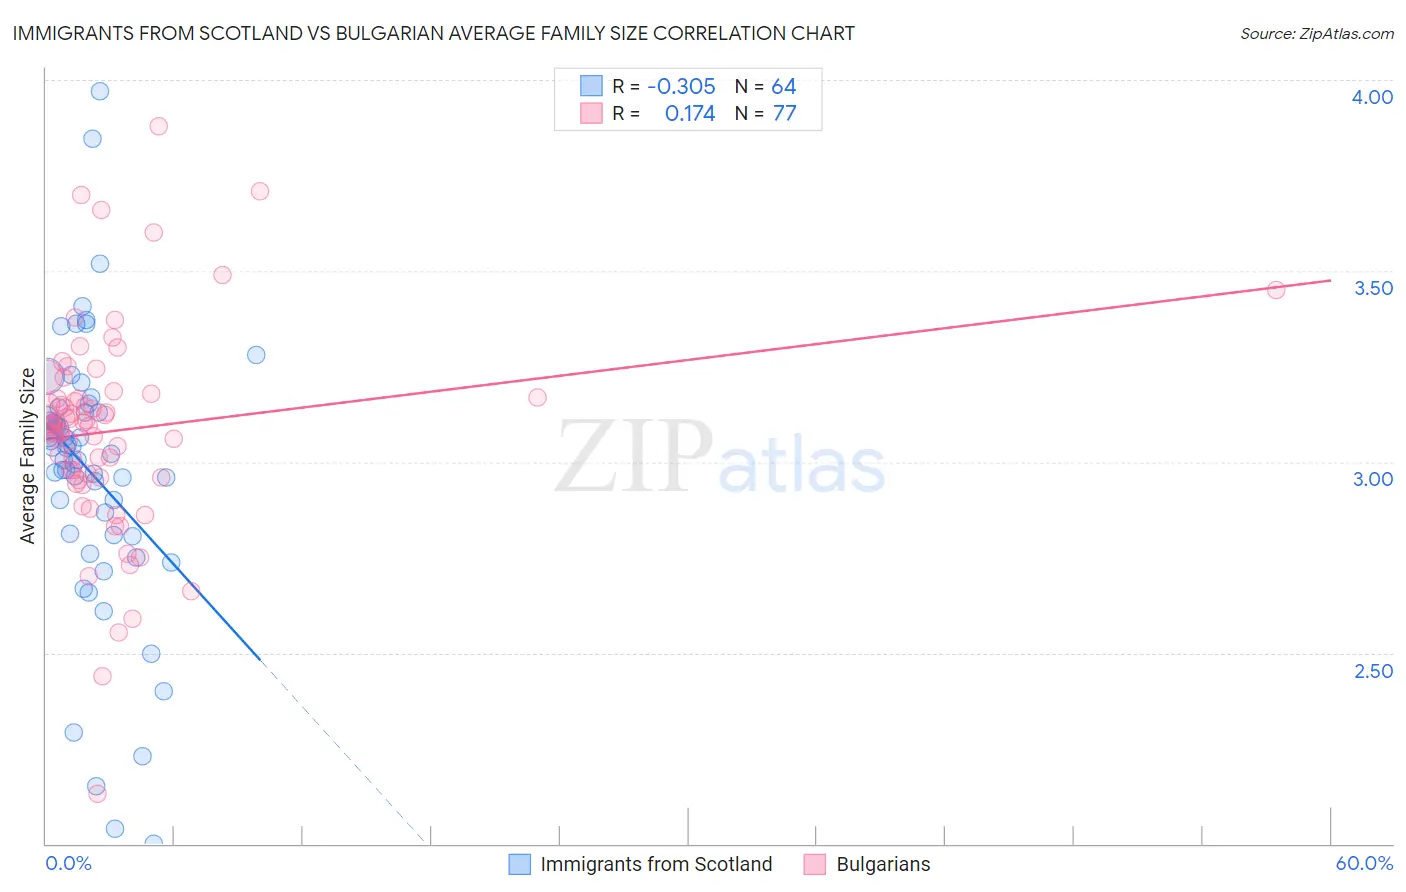
Immigrants from Scotland vs Bulgarian Average Family Size Correlation Chart
The statistical analysis conducted on geographies consisting of 196,383,417 people shows a mild negative correlation between the proportion of Immigrants from Scotland and average family size in the United States with a correlation coefficient (R) of -0.305 and weighted average of 3.12. Similarly, the statistical analysis conducted on geographies consisting of 205,566,985 people shows a poor positive correlation between the proportion of Bulgarians and average family size in the United States with a correlation coefficient (R) of 0.174 and weighted average of 3.13, a difference of 0.060%.
Average Family Size Correlation Summary
| Measurement | Immigrants from Scotland | Bulgarian |
| Minimum | 2.00 | 2.13 |
| Maximum | 3.97 | 3.88 |
| Range | 1.97 | 1.75 |
| Mean | 2.97 | 3.08 |
| Median | 3.03 | 3.09 |
| Interquartile 25% (IQ1) | 2.81 | 2.96 |
| Interquartile 75% (IQ3) | 3.13 | 3.17 |
| Interquartile Range (IQR) | 0.32 | 0.21 |
| Standard Deviation (Sample) | 0.36 | 0.28 |
| Standard Deviation (Population) | 0.36 | 0.27 |
Demographics Similar to Immigrants from Scotland and Bulgarians by Average Family Size
In terms of average family size, the demographic groups most similar to Immigrants from Scotland are Russian (3.12, a difference of 0.020%), Immigrants from Australia (3.13, a difference of 0.060%), Immigrants from Northern Europe (3.13, a difference of 0.090%), Serbian (3.12, a difference of 0.090%), and Czechoslovakian (3.13, a difference of 0.13%). Similarly, the demographic groups most similar to Bulgarians are Immigrants from Australia (3.13, a difference of 0.0%), Immigrants from Northern Europe (3.13, a difference of 0.030%), Russian (3.12, a difference of 0.040%), Czechoslovakian (3.13, a difference of 0.070%), and Northern European (3.13, a difference of 0.090%).
| Demographics | Rating | Rank | Average Family Size |
| Immigrants | Switzerland | 0.2 /100 | #304 | Tragic 3.13 |
| Australians | 0.1 /100 | #305 | Tragic 3.13 |
| Immigrants | Ireland | 0.1 /100 | #306 | Tragic 3.13 |
| Immigrants | Serbia | 0.1 /100 | #307 | Tragic 3.13 |
| Slavs | 0.1 /100 | #308 | Tragic 3.13 |
| Northern Europeans | 0.1 /100 | #309 | Tragic 3.13 |
| Czechoslovakians | 0.1 /100 | #310 | Tragic 3.13 |
| Immigrants | Northern Europe | 0.1 /100 | #311 | Tragic 3.13 |
| Immigrants | Australia | 0.1 /100 | #312 | Tragic 3.13 |
| Bulgarians | 0.1 /100 | #313 | Tragic 3.13 |
| Russians | 0.1 /100 | #314 | Tragic 3.12 |
| Immigrants | Scotland | 0.1 /100 | #315 | Tragic 3.12 |
| Serbians | 0.1 /100 | #316 | Tragic 3.12 |
| Italians | 0.1 /100 | #317 | Tragic 3.12 |
| Eastern Europeans | 0.1 /100 | #318 | Tragic 3.12 |
| Welsh | 0.1 /100 | #319 | Tragic 3.12 |
| Immigrants | North America | 0.0 /100 | #320 | Tragic 3.12 |
| Immigrants | Austria | 0.0 /100 | #321 | Tragic 3.12 |
| Immigrants | Canada | 0.0 /100 | #322 | Tragic 3.12 |
| Soviet Union | 0.0 /100 | #323 | Tragic 3.11 |
| Celtics | 0.0 /100 | #324 | Tragic 3.11 |