Nepalese vs Immigrants from Serbia Average Family Size
COMPARE
Nepalese
Immigrants from Serbia
Average Family Size
Average Family Size Comparison
Nepalese
Immigrants from Serbia
3.42
AVERAGE FAMILY SIZE
100.0/ 100
METRIC RATING
29th/ 347
METRIC RANK
3.13
AVERAGE FAMILY SIZE
0.1/ 100
METRIC RATING
307th/ 347
METRIC RANK
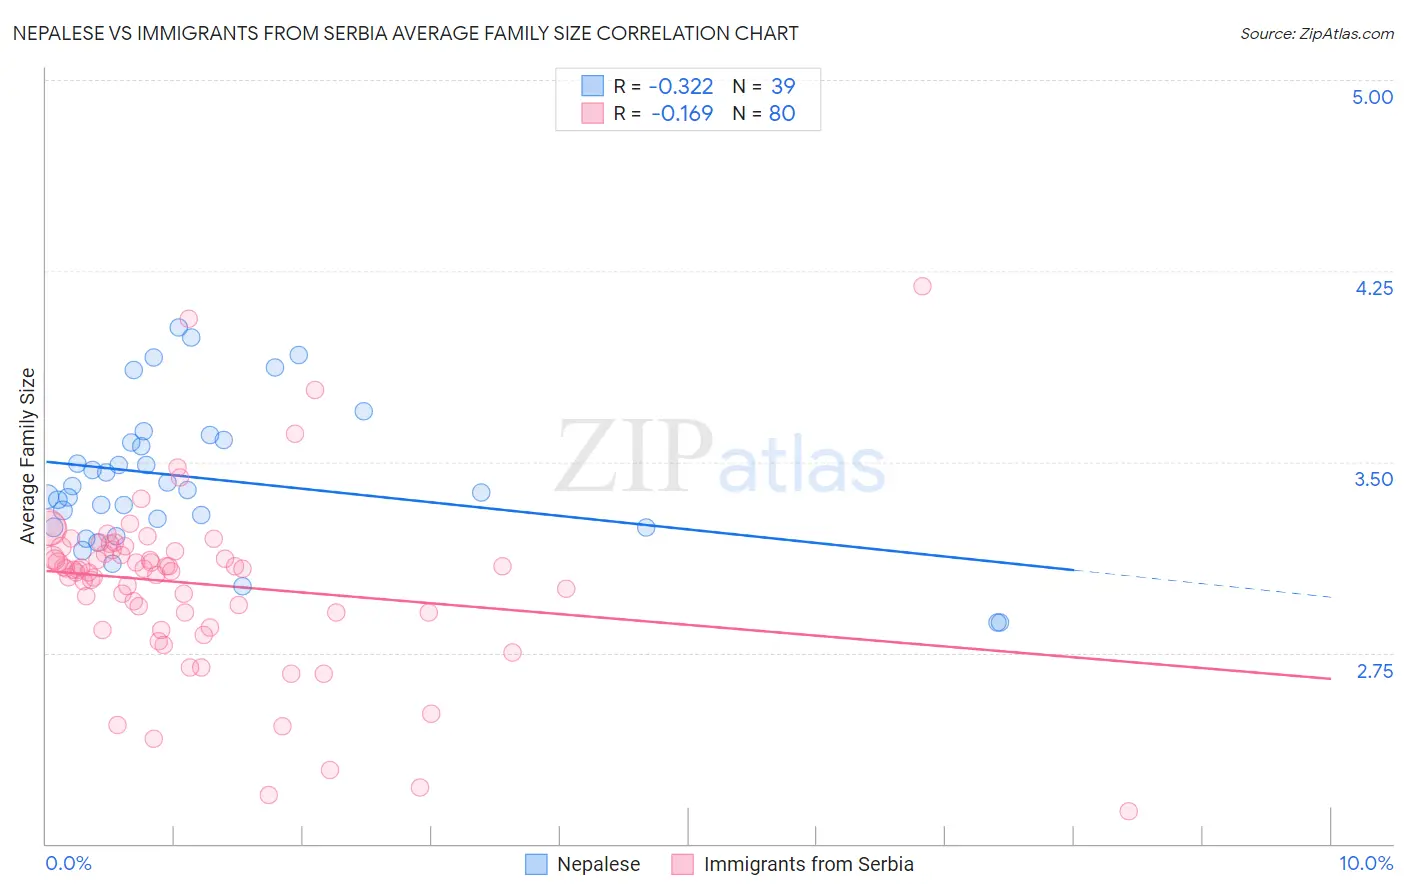
Nepalese vs Immigrants from Serbia Average Family Size Correlation Chart
The statistical analysis conducted on geographies consisting of 24,519,269 people shows a mild negative correlation between the proportion of Nepalese and average family size in the United States with a correlation coefficient (R) of -0.322 and weighted average of 3.42. Similarly, the statistical analysis conducted on geographies consisting of 131,725,495 people shows a poor negative correlation between the proportion of Immigrants from Serbia and average family size in the United States with a correlation coefficient (R) of -0.169 and weighted average of 3.13, a difference of 9.3%.
Average Family Size Correlation Summary
| Measurement | Nepalese | Immigrants from Serbia |
| Minimum | 2.87 | 2.13 |
| Maximum | 4.03 | 4.19 |
| Range | 1.16 | 2.06 |
| Mean | 3.43 | 3.02 |
| Median | 3.39 | 3.08 |
| Interquartile 25% (IQ1) | 3.24 | 2.91 |
| Interquartile 75% (IQ3) | 3.59 | 3.15 |
| Interquartile Range (IQR) | 0.34 | 0.24 |
| Standard Deviation (Sample) | 0.28 | 0.34 |
| Standard Deviation (Population) | 0.28 | 0.34 |
Similar Demographics by Average Family Size
Demographics Similar to Nepalese by Average Family Size
In terms of average family size, the demographic groups most similar to Nepalese are Samoan (3.42, a difference of 0.030%), Immigrants from Latin America (3.42, a difference of 0.090%), Mexican American Indian (3.43, a difference of 0.21%), Native Hawaiian (3.43, a difference of 0.22%), and Central American (3.41, a difference of 0.23%).
| Demographics | Rating | Rank | Average Family Size |
| Apache | 100.0 /100 | #22 | Exceptional 3.46 |
| Immigrants | Fiji | 100.0 /100 | #23 | Exceptional 3.45 |
| Natives/Alaskans | 100.0 /100 | #24 | Exceptional 3.45 |
| Yakama | 100.0 /100 | #25 | Exceptional 3.45 |
| Native Hawaiians | 100.0 /100 | #26 | Exceptional 3.43 |
| Mexican American Indians | 100.0 /100 | #27 | Exceptional 3.43 |
| Immigrants | Latin America | 100.0 /100 | #28 | Exceptional 3.42 |
| Nepalese | 100.0 /100 | #29 | Exceptional 3.42 |
| Samoans | 100.0 /100 | #30 | Exceptional 3.42 |
| Central Americans | 100.0 /100 | #31 | Exceptional 3.41 |
| Immigrants | Guatemala | 100.0 /100 | #32 | Exceptional 3.41 |
| Hawaiians | 100.0 /100 | #33 | Exceptional 3.41 |
| Hispanics or Latinos | 100.0 /100 | #34 | Exceptional 3.41 |
| Guatemalans | 100.0 /100 | #35 | Exceptional 3.40 |
| Immigrants | Guyana | 100.0 /100 | #36 | Exceptional 3.40 |
Demographics Similar to Immigrants from Serbia by Average Family Size
In terms of average family size, the demographic groups most similar to Immigrants from Serbia are Immigrants from Ireland (3.13, a difference of 0.010%), Slavic (3.13, a difference of 0.050%), Northern European (3.13, a difference of 0.060%), Australian (3.13, a difference of 0.070%), and Czechoslovakian (3.13, a difference of 0.080%).
| Demographics | Rating | Rank | Average Family Size |
| Immigrants | Sweden | 0.2 /100 | #300 | Tragic 3.14 |
| Macedonians | 0.2 /100 | #301 | Tragic 3.13 |
| Immigrants | Latvia | 0.2 /100 | #302 | Tragic 3.13 |
| British | 0.2 /100 | #303 | Tragic 3.13 |
| Immigrants | Switzerland | 0.2 /100 | #304 | Tragic 3.13 |
| Australians | 0.1 /100 | #305 | Tragic 3.13 |
| Immigrants | Ireland | 0.1 /100 | #306 | Tragic 3.13 |
| Immigrants | Serbia | 0.1 /100 | #307 | Tragic 3.13 |
| Slavs | 0.1 /100 | #308 | Tragic 3.13 |
| Northern Europeans | 0.1 /100 | #309 | Tragic 3.13 |
| Czechoslovakians | 0.1 /100 | #310 | Tragic 3.13 |
| Immigrants | Northern Europe | 0.1 /100 | #311 | Tragic 3.13 |
| Immigrants | Australia | 0.1 /100 | #312 | Tragic 3.13 |
| Bulgarians | 0.1 /100 | #313 | Tragic 3.13 |
| Russians | 0.1 /100 | #314 | Tragic 3.12 |