Nepalese vs Venezuelan Average Family Size
COMPARE
Nepalese
Venezuelan
Average Family Size
Average Family Size Comparison
Nepalese
Venezuelans
3.42
AVERAGE FAMILY SIZE
100.0/ 100
METRIC RATING
29th/ 347
METRIC RANK
3.25
AVERAGE FAMILY SIZE
81.4/ 100
METRIC RATING
141st/ 347
METRIC RANK
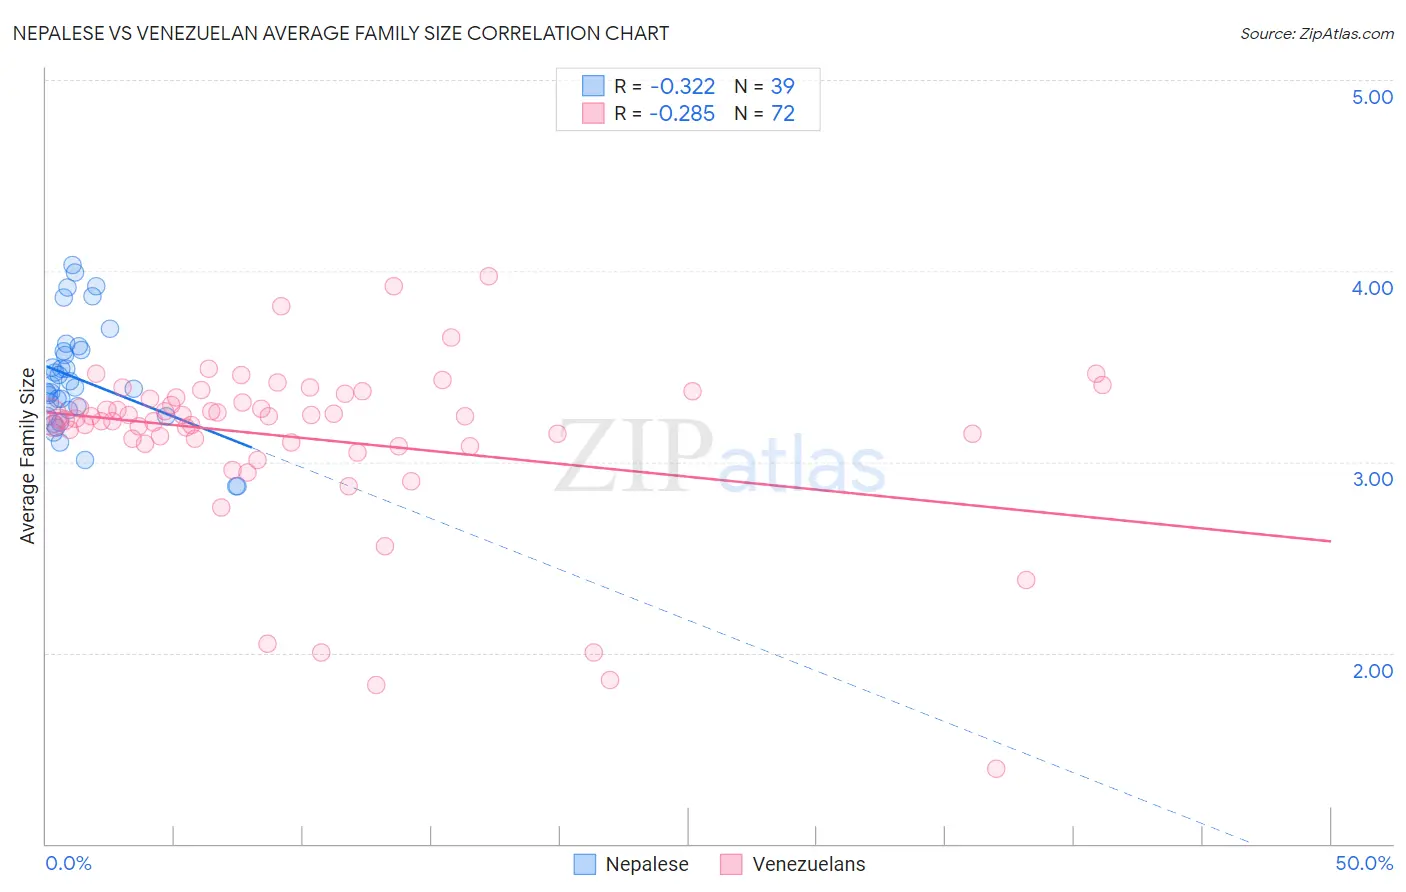
Nepalese vs Venezuelan Average Family Size Correlation Chart
The statistical analysis conducted on geographies consisting of 24,519,269 people shows a mild negative correlation between the proportion of Nepalese and average family size in the United States with a correlation coefficient (R) of -0.322 and weighted average of 3.42. Similarly, the statistical analysis conducted on geographies consisting of 306,140,333 people shows a weak negative correlation between the proportion of Venezuelans and average family size in the United States with a correlation coefficient (R) of -0.285 and weighted average of 3.25, a difference of 5.2%.
Average Family Size Correlation Summary
| Measurement | Nepalese | Venezuelan |
| Minimum | 2.87 | 1.39 |
| Maximum | 4.03 | 3.97 |
| Range | 1.16 | 2.58 |
| Mean | 3.43 | 3.12 |
| Median | 3.39 | 3.23 |
| Interquartile 25% (IQ1) | 3.24 | 3.10 |
| Interquartile 75% (IQ3) | 3.59 | 3.33 |
| Interquartile Range (IQR) | 0.34 | 0.24 |
| Standard Deviation (Sample) | 0.28 | 0.46 |
| Standard Deviation (Population) | 0.28 | 0.45 |
Similar Demographics by Average Family Size
Demographics Similar to Nepalese by Average Family Size
In terms of average family size, the demographic groups most similar to Nepalese are Samoan (3.42, a difference of 0.030%), Immigrants from Latin America (3.42, a difference of 0.090%), Mexican American Indian (3.43, a difference of 0.21%), Native Hawaiian (3.43, a difference of 0.22%), and Central American (3.41, a difference of 0.23%).
| Demographics | Rating | Rank | Average Family Size |
| Apache | 100.0 /100 | #22 | Exceptional 3.46 |
| Immigrants | Fiji | 100.0 /100 | #23 | Exceptional 3.45 |
| Natives/Alaskans | 100.0 /100 | #24 | Exceptional 3.45 |
| Yakama | 100.0 /100 | #25 | Exceptional 3.45 |
| Native Hawaiians | 100.0 /100 | #26 | Exceptional 3.43 |
| Mexican American Indians | 100.0 /100 | #27 | Exceptional 3.43 |
| Immigrants | Latin America | 100.0 /100 | #28 | Exceptional 3.42 |
| Nepalese | 100.0 /100 | #29 | Exceptional 3.42 |
| Samoans | 100.0 /100 | #30 | Exceptional 3.42 |
| Central Americans | 100.0 /100 | #31 | Exceptional 3.41 |
| Immigrants | Guatemala | 100.0 /100 | #32 | Exceptional 3.41 |
| Hawaiians | 100.0 /100 | #33 | Exceptional 3.41 |
| Hispanics or Latinos | 100.0 /100 | #34 | Exceptional 3.41 |
| Guatemalans | 100.0 /100 | #35 | Exceptional 3.40 |
| Immigrants | Guyana | 100.0 /100 | #36 | Exceptional 3.40 |
Demographics Similar to Venezuelans by Average Family Size
In terms of average family size, the demographic groups most similar to Venezuelans are Subsaharan African (3.25, a difference of 0.0%), Cuban (3.25, a difference of 0.010%), Immigrants from Ethiopia (3.25, a difference of 0.010%), Liberian (3.25, a difference of 0.010%), and Bhutanese (3.25, a difference of 0.010%).
| Demographics | Rating | Rank | Average Family Size |
| Africans | 84.9 /100 | #134 | Excellent 3.25 |
| Panamanians | 84.2 /100 | #135 | Excellent 3.25 |
| Comanche | 82.8 /100 | #136 | Excellent 3.25 |
| Immigrants | Middle Africa | 82.4 /100 | #137 | Excellent 3.25 |
| Cubans | 81.8 /100 | #138 | Excellent 3.25 |
| Immigrants | Ethiopia | 81.6 /100 | #139 | Excellent 3.25 |
| Sub-Saharan Africans | 81.6 /100 | #140 | Excellent 3.25 |
| Venezuelans | 81.4 /100 | #141 | Excellent 3.25 |
| Liberians | 81.2 /100 | #142 | Excellent 3.25 |
| Bhutanese | 81.0 /100 | #143 | Excellent 3.25 |
| Tsimshian | 80.2 /100 | #144 | Excellent 3.25 |
| Armenians | 78.2 /100 | #145 | Good 3.25 |
| Immigrants | Africa | 77.9 /100 | #146 | Good 3.25 |
| Immigrants | Jordan | 75.7 /100 | #147 | Good 3.24 |
| Blackfeet | 75.0 /100 | #148 | Good 3.24 |