Nepalese vs Scandinavian Average Family Size
COMPARE
Nepalese
Scandinavian
Average Family Size
Average Family Size Comparison
Nepalese
Scandinavians
3.42
AVERAGE FAMILY SIZE
100.0/ 100
METRIC RATING
29th/ 347
METRIC RANK
3.14
AVERAGE FAMILY SIZE
0.2/ 100
METRIC RATING
293rd/ 347
METRIC RANK
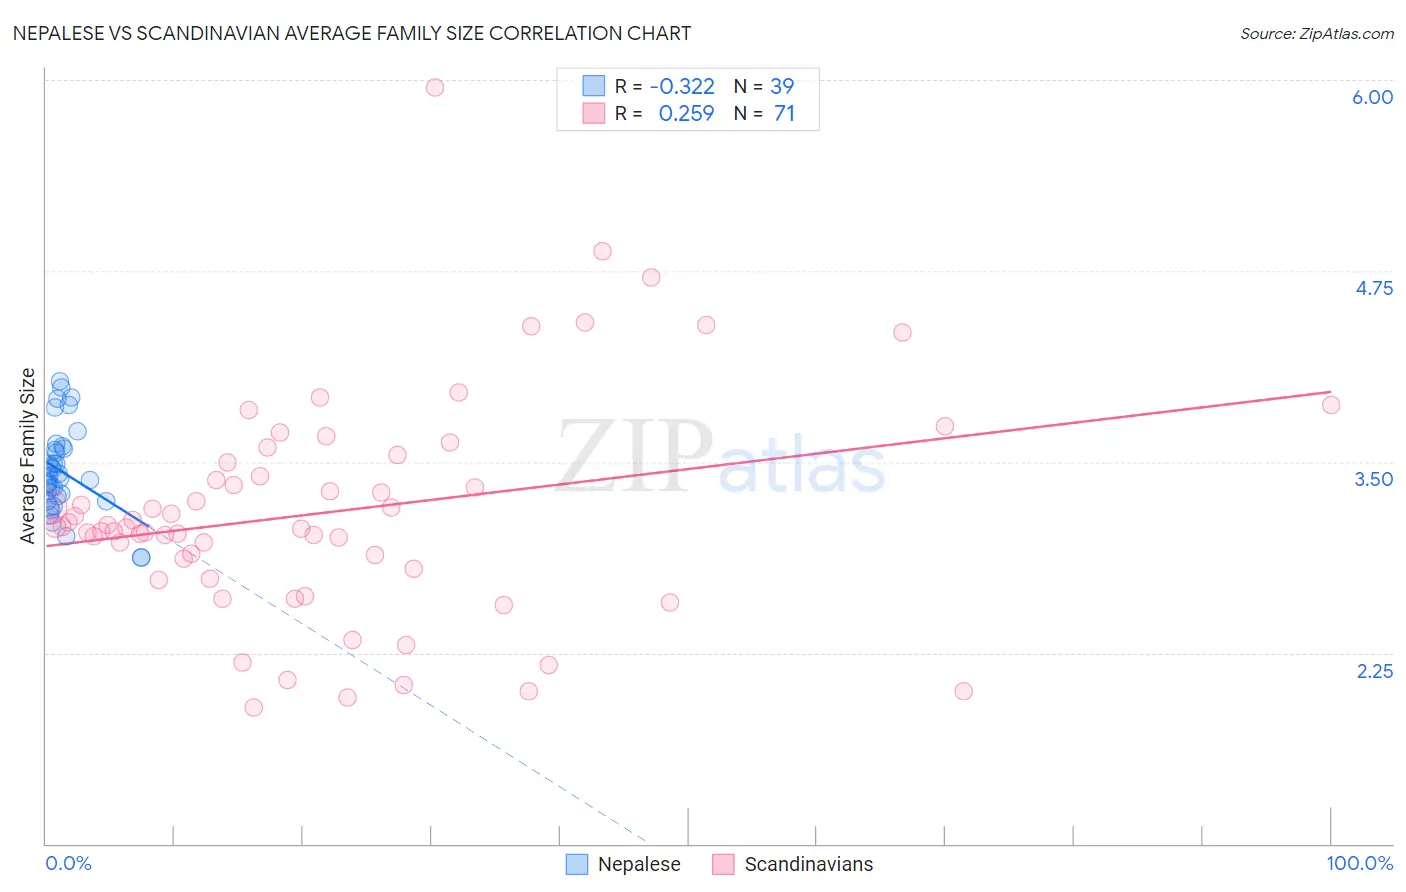
Nepalese vs Scandinavian Average Family Size Correlation Chart
The statistical analysis conducted on geographies consisting of 24,519,269 people shows a mild negative correlation between the proportion of Nepalese and average family size in the United States with a correlation coefficient (R) of -0.322 and weighted average of 3.42. Similarly, the statistical analysis conducted on geographies consisting of 472,285,775 people shows a weak positive correlation between the proportion of Scandinavians and average family size in the United States with a correlation coefficient (R) of 0.259 and weighted average of 3.14, a difference of 9.0%.
Average Family Size Correlation Summary
| Measurement | Nepalese | Scandinavian |
| Minimum | 2.87 | 1.89 |
| Maximum | 4.03 | 5.95 |
| Range | 1.16 | 4.06 |
| Mean | 3.43 | 3.17 |
| Median | 3.39 | 3.07 |
| Interquartile 25% (IQ1) | 3.24 | 2.80 |
| Interquartile 75% (IQ3) | 3.59 | 3.49 |
| Interquartile Range (IQR) | 0.34 | 0.69 |
| Standard Deviation (Sample) | 0.28 | 0.73 |
| Standard Deviation (Population) | 0.28 | 0.72 |
Similar Demographics by Average Family Size
Demographics Similar to Nepalese by Average Family Size
In terms of average family size, the demographic groups most similar to Nepalese are Samoan (3.42, a difference of 0.030%), Immigrants from Latin America (3.42, a difference of 0.090%), Mexican American Indian (3.43, a difference of 0.21%), Native Hawaiian (3.43, a difference of 0.22%), and Central American (3.41, a difference of 0.23%).
| Demographics | Rating | Rank | Average Family Size |
| Apache | 100.0 /100 | #22 | Exceptional 3.46 |
| Immigrants | Fiji | 100.0 /100 | #23 | Exceptional 3.45 |
| Natives/Alaskans | 100.0 /100 | #24 | Exceptional 3.45 |
| Yakama | 100.0 /100 | #25 | Exceptional 3.45 |
| Native Hawaiians | 100.0 /100 | #26 | Exceptional 3.43 |
| Mexican American Indians | 100.0 /100 | #27 | Exceptional 3.43 |
| Immigrants | Latin America | 100.0 /100 | #28 | Exceptional 3.42 |
| Nepalese | 100.0 /100 | #29 | Exceptional 3.42 |
| Samoans | 100.0 /100 | #30 | Exceptional 3.42 |
| Central Americans | 100.0 /100 | #31 | Exceptional 3.41 |
| Immigrants | Guatemala | 100.0 /100 | #32 | Exceptional 3.41 |
| Hawaiians | 100.0 /100 | #33 | Exceptional 3.41 |
| Hispanics or Latinos | 100.0 /100 | #34 | Exceptional 3.41 |
| Guatemalans | 100.0 /100 | #35 | Exceptional 3.40 |
| Immigrants | Guyana | 100.0 /100 | #36 | Exceptional 3.40 |
Demographics Similar to Scandinavians by Average Family Size
In terms of average family size, the demographic groups most similar to Scandinavians are European (3.14, a difference of 0.010%), Immigrants from Croatia (3.14, a difference of 0.020%), Alsatian (3.14, a difference of 0.030%), Austrian (3.14, a difference of 0.030%), and Ukrainian (3.14, a difference of 0.030%).
| Demographics | Rating | Rank | Average Family Size |
| Immigrants | Netherlands | 0.3 /100 | #286 | Tragic 3.14 |
| Greeks | 0.3 /100 | #287 | Tragic 3.14 |
| Immigrants | Czechoslovakia | 0.3 /100 | #288 | Tragic 3.14 |
| Immigrants | Norway | 0.3 /100 | #289 | Tragic 3.14 |
| Cypriots | 0.3 /100 | #290 | Tragic 3.14 |
| Alsatians | 0.2 /100 | #291 | Tragic 3.14 |
| Europeans | 0.2 /100 | #292 | Tragic 3.14 |
| Scandinavians | 0.2 /100 | #293 | Tragic 3.14 |
| Immigrants | Croatia | 0.2 /100 | #294 | Tragic 3.14 |
| Austrians | 0.2 /100 | #295 | Tragic 3.14 |
| Ukrainians | 0.2 /100 | #296 | Tragic 3.14 |
| Immigrants | Western Europe | 0.2 /100 | #297 | Tragic 3.14 |
| Colville | 0.2 /100 | #298 | Tragic 3.14 |
| Canadians | 0.2 /100 | #299 | Tragic 3.14 |
| Immigrants | Sweden | 0.2 /100 | #300 | Tragic 3.14 |