Nepalese vs Slovene Average Family Size
COMPARE
Nepalese
Slovene
Average Family Size
Average Family Size Comparison
Nepalese
Slovenes
3.42
AVERAGE FAMILY SIZE
100.0/ 100
METRIC RATING
29th/ 347
METRIC RANK
3.07
AVERAGE FAMILY SIZE
0.0/ 100
METRIC RATING
345th/ 347
METRIC RANK
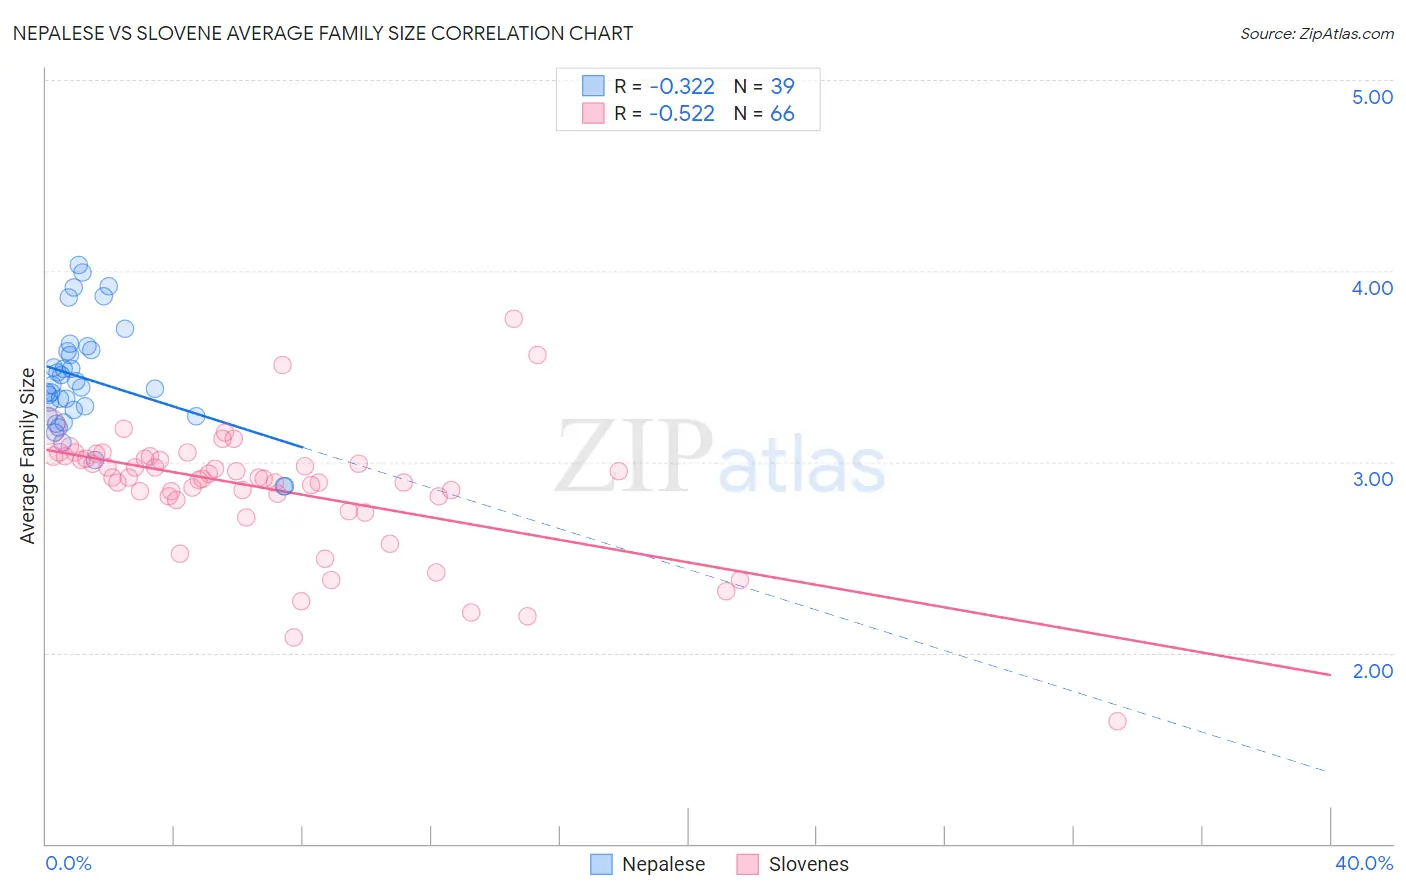
Nepalese vs Slovene Average Family Size Correlation Chart
The statistical analysis conducted on geographies consisting of 24,519,269 people shows a mild negative correlation between the proportion of Nepalese and average family size in the United States with a correlation coefficient (R) of -0.322 and weighted average of 3.42. Similarly, the statistical analysis conducted on geographies consisting of 261,257,003 people shows a substantial negative correlation between the proportion of Slovenes and average family size in the United States with a correlation coefficient (R) of -0.522 and weighted average of 3.07, a difference of 11.3%.
Average Family Size Correlation Summary
| Measurement | Nepalese | Slovene |
| Minimum | 2.87 | 1.64 |
| Maximum | 4.03 | 3.75 |
| Range | 1.16 | 2.11 |
| Mean | 3.43 | 2.86 |
| Median | 3.39 | 2.92 |
| Interquartile 25% (IQ1) | 3.24 | 2.82 |
| Interquartile 75% (IQ3) | 3.59 | 3.03 |
| Interquartile Range (IQR) | 0.34 | 0.21 |
| Standard Deviation (Sample) | 0.28 | 0.34 |
| Standard Deviation (Population) | 0.28 | 0.33 |
Similar Demographics by Average Family Size
Demographics Similar to Nepalese by Average Family Size
In terms of average family size, the demographic groups most similar to Nepalese are Samoan (3.42, a difference of 0.030%), Immigrants from Latin America (3.42, a difference of 0.090%), Mexican American Indian (3.43, a difference of 0.21%), Native Hawaiian (3.43, a difference of 0.22%), and Central American (3.41, a difference of 0.23%).
| Demographics | Rating | Rank | Average Family Size |
| Apache | 100.0 /100 | #22 | Exceptional 3.46 |
| Immigrants | Fiji | 100.0 /100 | #23 | Exceptional 3.45 |
| Natives/Alaskans | 100.0 /100 | #24 | Exceptional 3.45 |
| Yakama | 100.0 /100 | #25 | Exceptional 3.45 |
| Native Hawaiians | 100.0 /100 | #26 | Exceptional 3.43 |
| Mexican American Indians | 100.0 /100 | #27 | Exceptional 3.43 |
| Immigrants | Latin America | 100.0 /100 | #28 | Exceptional 3.42 |
| Nepalese | 100.0 /100 | #29 | Exceptional 3.42 |
| Samoans | 100.0 /100 | #30 | Exceptional 3.42 |
| Central Americans | 100.0 /100 | #31 | Exceptional 3.41 |
| Immigrants | Guatemala | 100.0 /100 | #32 | Exceptional 3.41 |
| Hawaiians | 100.0 /100 | #33 | Exceptional 3.41 |
| Hispanics or Latinos | 100.0 /100 | #34 | Exceptional 3.41 |
| Guatemalans | 100.0 /100 | #35 | Exceptional 3.40 |
| Immigrants | Guyana | 100.0 /100 | #36 | Exceptional 3.40 |
Demographics Similar to Slovenes by Average Family Size
In terms of average family size, the demographic groups most similar to Slovenes are French Canadian (3.07, a difference of 0.040%), Norwegian (3.08, a difference of 0.28%), Slovak (3.06, a difference of 0.29%), Carpatho Rusyn (3.06, a difference of 0.35%), and German (3.09, a difference of 0.51%).
| Demographics | Rating | Rank | Average Family Size |
| Estonians | 0.0 /100 | #333 | Tragic 3.10 |
| Lithuanians | 0.0 /100 | #334 | Tragic 3.10 |
| Luxembourgers | 0.0 /100 | #335 | Tragic 3.10 |
| Irish | 0.0 /100 | #336 | Tragic 3.10 |
| Swedes | 0.0 /100 | #337 | Tragic 3.10 |
| French | 0.0 /100 | #338 | Tragic 3.10 |
| Croatians | 0.0 /100 | #339 | Tragic 3.10 |
| Finns | 0.0 /100 | #340 | Tragic 3.09 |
| Poles | 0.0 /100 | #341 | Tragic 3.09 |
| Germans | 0.0 /100 | #342 | Tragic 3.09 |
| Norwegians | 0.0 /100 | #343 | Tragic 3.08 |
| French Canadians | 0.0 /100 | #344 | Tragic 3.07 |
| Slovenes | 0.0 /100 | #345 | Tragic 3.07 |
| Slovaks | 0.0 /100 | #346 | Tragic 3.06 |
| Carpatho Rusyns | 0.0 /100 | #347 | Tragic 3.06 |