Nepalese vs Immigrants from Uganda 11th Grade
COMPARE
Nepalese
Immigrants from Uganda
11th Grade
11th Grade Comparison
Nepalese
Immigrants from Uganda
89.5%
11TH GRADE
0.0/ 100
METRIC RATING
308th/ 347
METRIC RANK
92.3%
11TH GRADE
25.2/ 100
METRIC RATING
199th/ 347
METRIC RANK
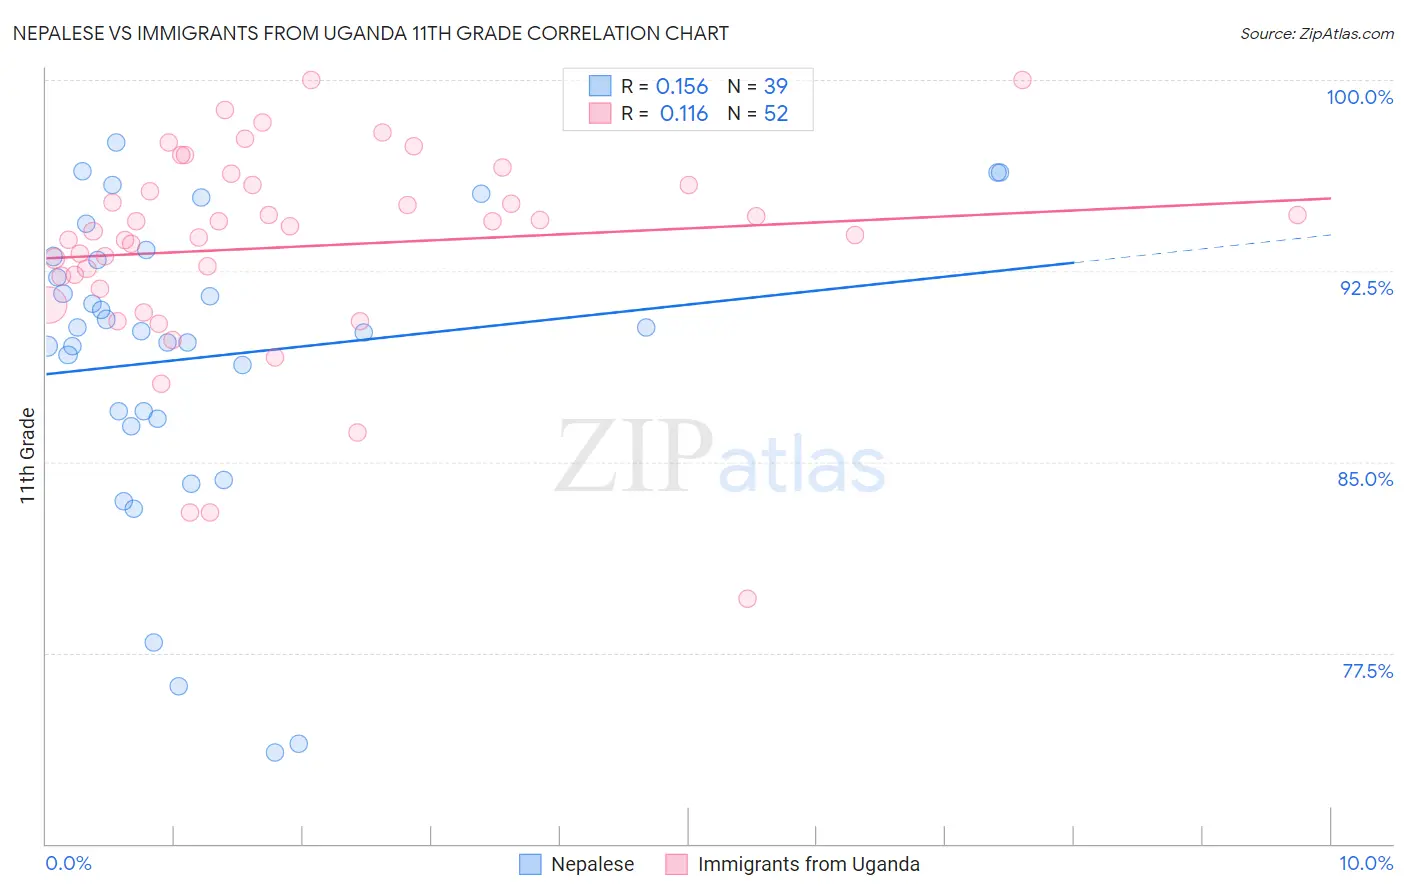
Nepalese vs Immigrants from Uganda 11th Grade Correlation Chart
The statistical analysis conducted on geographies consisting of 24,519,269 people shows a poor positive correlation between the proportion of Nepalese and percentage of population with at least 11th grade education in the United States with a correlation coefficient (R) of 0.156 and weighted average of 89.5%. Similarly, the statistical analysis conducted on geographies consisting of 125,969,169 people shows a poor positive correlation between the proportion of Immigrants from Uganda and percentage of population with at least 11th grade education in the United States with a correlation coefficient (R) of 0.116 and weighted average of 92.3%, a difference of 3.1%.
11th Grade Correlation Summary
| Measurement | Nepalese | Immigrants from Uganda |
| Minimum | 73.6% | 79.6% |
| Maximum | 97.6% | 100.0% |
| Range | 24.0% | 20.4% |
| Mean | 89.1% | 93.5% |
| Median | 90.1% | 94.2% |
| Interquartile 25% (IQ1) | 86.7% | 92.0% |
| Interquartile 75% (IQ3) | 93.1% | 95.9% |
| Interquartile Range (IQR) | 6.4% | 3.8% |
| Standard Deviation (Sample) | 6.0% | 4.1% |
| Standard Deviation (Population) | 5.9% | 4.1% |
Similar Demographics by 11th Grade
Demographics Similar to Nepalese by 11th Grade
In terms of 11th grade, the demographic groups most similar to Nepalese are Immigrants from Dominica (89.5%, a difference of 0.020%), Immigrants from Bangladesh (89.5%, a difference of 0.020%), Yaqui (89.5%, a difference of 0.030%), Ecuadorian (89.6%, a difference of 0.070%), and Vietnamese (89.4%, a difference of 0.10%).
| Demographics | Rating | Rank | 11th Grade |
| Guyanese | 0.0 /100 | #301 | Tragic 89.9% |
| Immigrants | Guyana | 0.0 /100 | #302 | Tragic 89.7% |
| Immigrants | Immigrants | 0.0 /100 | #303 | Tragic 89.7% |
| Yuman | 0.0 /100 | #304 | Tragic 89.7% |
| Immigrants | Cambodia | 0.0 /100 | #305 | Tragic 89.6% |
| Ecuadorians | 0.0 /100 | #306 | Tragic 89.6% |
| Immigrants | Dominica | 0.0 /100 | #307 | Tragic 89.5% |
| Nepalese | 0.0 /100 | #308 | Tragic 89.5% |
| Immigrants | Bangladesh | 0.0 /100 | #309 | Tragic 89.5% |
| Yaqui | 0.0 /100 | #310 | Tragic 89.5% |
| Vietnamese | 0.0 /100 | #311 | Tragic 89.4% |
| Immigrants | Portugal | 0.0 /100 | #312 | Tragic 89.3% |
| Immigrants | Caribbean | 0.0 /100 | #313 | Tragic 89.1% |
| Cape Verdeans | 0.0 /100 | #314 | Tragic 89.1% |
| Immigrants | Ecuador | 0.0 /100 | #315 | Tragic 89.1% |
Demographics Similar to Immigrants from Uganda by 11th Grade
In terms of 11th grade, the demographic groups most similar to Immigrants from Uganda are Hawaiian (92.3%, a difference of 0.0%), Samoan (92.3%, a difference of 0.0%), Immigrants from China (92.3%, a difference of 0.0%), Marshallese (92.3%, a difference of 0.010%), and Liberian (92.3%, a difference of 0.020%).
| Demographics | Rating | Rank | 11th Grade |
| Immigrants | Syria | 30.4 /100 | #192 | Fair 92.3% |
| Moroccans | 28.7 /100 | #193 | Fair 92.3% |
| Sioux | 28.5 /100 | #194 | Fair 92.3% |
| Liberians | 26.8 /100 | #195 | Fair 92.3% |
| Panamanians | 26.4 /100 | #196 | Fair 92.3% |
| Marshallese | 26.0 /100 | #197 | Fair 92.3% |
| Hawaiians | 25.5 /100 | #198 | Fair 92.3% |
| Immigrants | Uganda | 25.2 /100 | #199 | Fair 92.3% |
| Samoans | 25.1 /100 | #200 | Fair 92.3% |
| Immigrants | China | 25.1 /100 | #201 | Fair 92.3% |
| Immigrants | Eastern Africa | 24.1 /100 | #202 | Fair 92.3% |
| Immigrants | Sudan | 23.5 /100 | #203 | Fair 92.3% |
| Immigrants | Hong Kong | 23.3 /100 | #204 | Fair 92.2% |
| Kiowa | 23.2 /100 | #205 | Fair 92.2% |
| Bolivians | 23.2 /100 | #206 | Fair 92.2% |